1. Introduction
Most companies want to build a self-serve data platform. But what does a self-serve data platform mean? The term self-serve is overloaded. If you
Have faced problems with building a self-serve data platform
Have never seen a successful “self-serve” implementation
Are shocked by the amounts of money companies spend on various “self-serve” analytics/bi/de tools
Feel that you are throwing away money since you can’t get user adoption for your self-serve platform
Feel self-serve is an overly idealistic reduction of the nuance involved in setting up infrastructure to solve problems
Then this post is for you. In this post, we will go over what self-serve is, its purpose, its core components, when necessary, and an approach you can follow to build a solid self-serve platform.
2. What is self-serve?
Let’s define self-serve (hint: it’s not a tool). Self-serve refers to processes that make it easier for the end-user to access the data, learn about it, and understand its creation and meaning.
Setting up a self-serve platform involves identifying your end-users, their objectives & workflows. The core idea of a self-serve platform is to reduce the setup/pre-work/knowledge sessions that end-users need to do to start using the data effectively.
2.1. Components of a self-serve platform
Let’s look at the different components involved in a self-serve platform and their purposes:
Data sets: Datasets used by the end-users, e.g., datamarts, OBT, etc.Data access: Refers to how an end-user accesses the datasets, e.g., dashboards, reports, BI tools, etc.Data discovery: Refers to how an end-user can find a dataset they are looking for.Data documentation: Refers to how an end-user can learn about the data, what the columns mean, how they are calculated, & what the column types are.Data lineage: Refers to how an end-user can find information about the upstream sources and downstream dependencies for a given dataset.Data quality statistics: Refers to how an end-user can find information about a dataset’s quality over the past.Data management: Refers to how an end-user can request data manipulation requests, such as GDPR, PII masking, etc.Data ownership: Refers to how an end-user can identify which team/employee owns a dataset.
Decrease end-user dependence on DEs: The core idea of a self-serve data platform is to reduce the reliance of end-users on data engineers.
3. Building a self-serve data platform
This section will detail any self-serve data platform’s two essential parts.
3.1. Creating dataset(s)
3.1.1. Gather requirements
As with any project, start with gathering requirements. Check out this article that explains it in detail.
Build a proof-of-concept dataset and get buy-in from the end users. Ensure that the end user validates the data. Ideally, they should be excited that this dataset makes their life easier.
3.1.2. Get data foundations right
Getting the foundational datasets right makes everything else easier. Identify the key business entities (e.g., customer, vendor, employee) and critical business processes (e.g., sales, purchases, marketing activities); they become the fact and dimension tables, respectively. Ensure you have data available at the lowest grain (e.g., for a checkout event and have specific details of each product and its attributes like discounts, etc.)
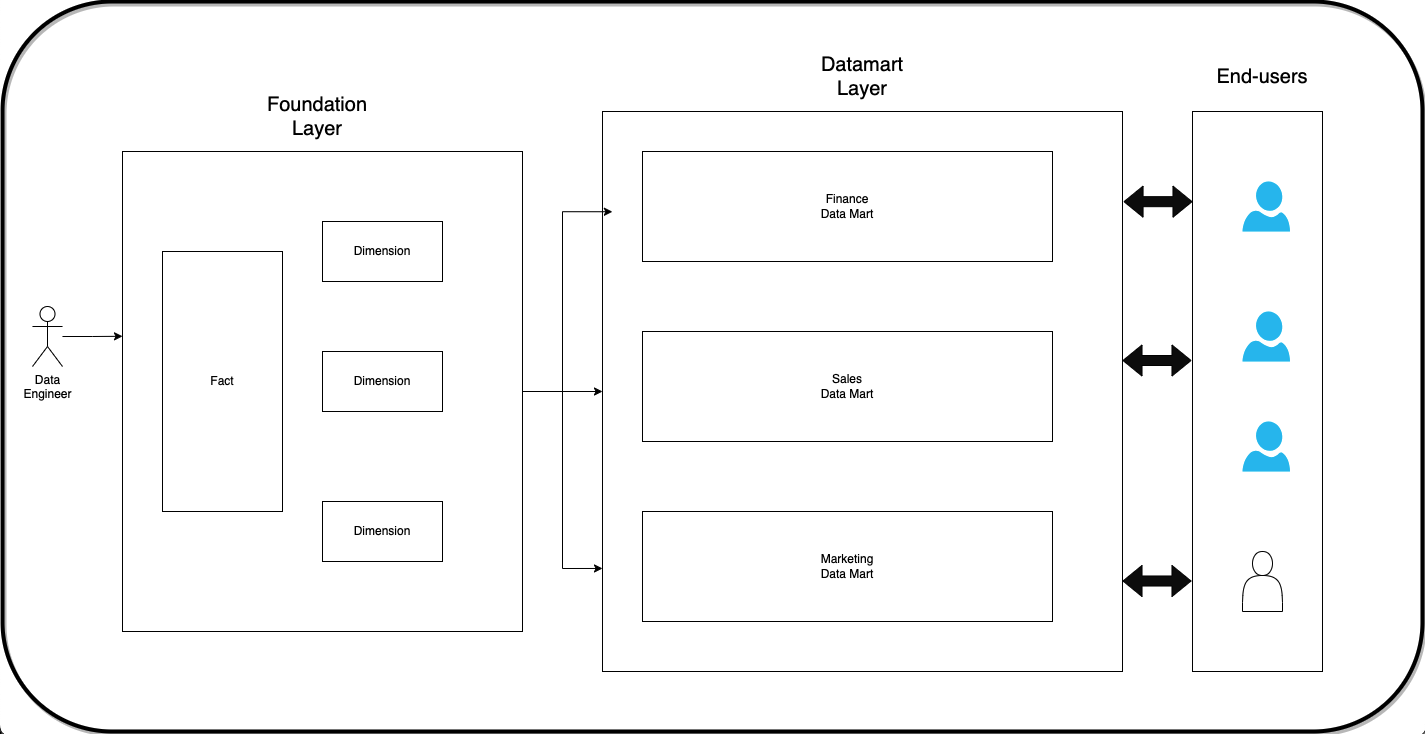
Use these fact and dimension tables to build end-user team-specific datasets in their data marts. Call them certified datasets and establish that the data team is responsible for this data set and will not support ad-hoc datasets.
Ensure the data in the data mart layer can be traced back to the source tables (data lineage). Data mart datasets are made available for end-user querying. Advanced end-users can access the fact/dim tables if needed.
3.2. Accessing data
Once you have the data, the next step is enabling the end-user to access the data. Let’s look at different types of data access and the persona of users who use them.
- Static report: Reports that do not change when the source dataset changes.
Non-editable: Presentation slides, pdf, jpeg, etc.Editable: Data extracted to Excel, csv, etc.
- Dynamic report: Reports that change when the source dataset changes.
Non-editable: Dashboards with filters (think drop downs, date selector, string match, etc.) refreshed with data from the warehouse.Editable: BI tools that enable end-users to join predefined data sets (or facts and dims).
- SQL:
SQL-like access: LookerML, where end-users can define metrics, filters, etc., to create data sets.SQL access: End-users use SQL to access certified datasets in the data warehouse.Adv. SQL access: In addition to accessing certified datasets, end-users can access fact and dimension tables.
- API: Accessing data via APIs.
There are four types of data users. Let’s look at them and their typical data access type. 1. Leadership: non-editable report. 2. Data practitioner: (all of the above) + editable report, SQL access. 3. Adv Data practitioner: (all of the above) + Adv SQL access. 4. Backend engineers: (all of the above) + APIs.
3.3. Identify and remove dependencies
Once you have a process to develop datasets and a way for your end user to access them, the next step is to identify when and why end users are waiting on DEs and build systems to reduce this dependency.
Let’s look at the stages of end-user Data engineer(DE) dependency for the remaining components of the self-serve platform:
For every component of the self-serve platform, let’s look at the degrees of dependence from high(left) to low(right).
Note: DE = Data Engiener
- Data discovery: Ask DE -> check warehouse tables -> schema & table documentation -> data catalog.
- Data documentation: Ask DE -> data dictionary -> data catalog.
- Data lineage: Ask DE -> check orchestrator UI -> documentation -> data catalog.
- Data quality statistics: Ask DE -> check DQ history dashboard -> data catalog.
- Data management: Ask DE -> file a ticket -> documentation on how to do it -> data catalog.
- Data ownership: Ask DE -> check code base and git history -> ownership documentation -> data catalog.
We can see how documentation and data catalog are the last two stages of reducing dependency. Typically small-medium companies get maximum ROI by creating and maintaining documentation. But as your company grows and you have multiple teams, you might need a data catalog platform (e.g., DataHub, Amundsen).
4. Conclusion
I hope this article clarifies what people mean when they say self-serve and how it’s a set of components, not a tool. To recap, we saw.
- What self-serve is
- Creating datasets
- Various ways of accessing data
- Identifying & removing dependencies
Remember, self-serve is not a specific tool but a set of components aimed at reducing end-users dependence on data engineers. The next time you come across the term self-serve or are building a self-serve platform, remember that the key idea is to reduce reliance between teams & enable end-users to use the data effectively.
If you have any questions or comments, please leave them in the comment section below.