1. Introduction
Every data engineering interview includes a SQL round. If you are:
Worried about job descriptions asking for advanced SQL, but you are not sure what advanced SQL means for an interview
Having anxiety about being unable to get a job
Frustrated with online SQL courses teaching the basic dialects, but not a step-by-step approach to problem solving
If so, this post is for you. Imagine being able to dissect any SQL problem and make the interviewer say, “I need this person on my team.” That is what this post helps you do.
This post will go over a step-by-step approach to solving any SQL interview question. You will have an algorithm that you can use to show the interviewer that they’d be missing out if they don’t hire you.
This post is part 3 of my data engineering interview series:
- Data Engineering Interview Preparation Series #1: Data Structures and Algorithms
- Data Engineering Interview Preparation Series #2: System Design
- Data Engineering Interview Preparation Series #3: SQL
Pre-requisite: SQL Basics notebook, CTE and Window functions.
2. Step-by-step process to solve any SQL interview question
Every data engineering interview includes an SQL question. While it may be easy to jump directly into code, you must understand the requirements before starting to code.
We will go over a step-by-step approach to solve any SQL interview problem.
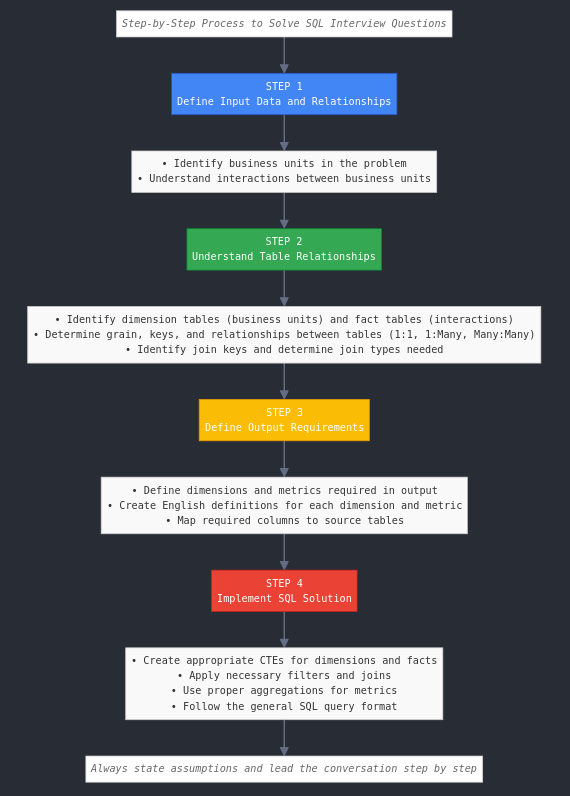
2.2. Understand the input table’s grain, foreign keys, and how they relate to each other
Get answers to these questions:
- Which tables represent business units (aka dimensions), and which represent interaction between them (aka facts)? What are their data schemas?
- For the dimension tables, determine: The grain, type of SCD, their natural keys, and surrogate key (if any).
- For the fact tables, determine: The grain and dimension IDs that are part of the fact table. If the fact table is multi-grained, what is the flag column to use to identify the grain?
- How are the dimensions and facts related? What is the
join keybetween the fact and dimension tables? - Determine the
type of relationshipbetween all the tables (if applicable): Are they 1:1, 1:Many, or Many:Many? - In case of Many:Many relationships, do you have a bridge table?
- In some instances, the data may not be complete; for example, an order fact table may not have all the items in the items fact table. In such cases you will have to make a call (while stating it to the interviewer) that you want to use orders as the driving table, which means when you join orders and items table you do a
left join(with orders as the left table) to get all the information from orders table.
Note this is one of the most crucial steps for the interview as it will directly impact the joins and group you’ll have to do.
2.3. Define the dimensions and metrics required for the output
Define the dimensions and metrics that are required. Use the question to define the dimension required.
The question will have terms like “for every x/produce a report of x/show the day-level information for x/etc.” Clearly state the x. Dimension is usually a combination of a time unit and a business unit.
For example, “Show me the top 5 sellers by revenue for each day.” This question shows that the dimensions needed are day and seller, and the metric is revenue.
Metrics are the numerical information that people analyse. They are calculated by aggregating numerical column(s) from the fact table.
Get answers to these questions:
- What are the dimensions and metrics required in the output?
- English definition of the dimension. For example, assume your input is an SCD2 customer, and you must produce a report with active customers. Definition: customer = customer from dim_customer with is_active = True and is_current = True
- English definition for the metric column. E.g., Revenue per customer. Revenue per customer = sum of (order_price - discount for that order) per customer
- From the definitions, determine which input tables the columns necessary for the outputs are from.
While writing out the definition in English may seem redundant, it is relatively easy to make changes at this stage, and it can help the interviewer point you in the right direction if you have made an incorrect assumption.
2.4. Filter/Join/Group by input columns to get the output dimension and metrics
With the outputs clearly defined and inputs mapped out, it’s time to code. In this step, you should do the following.
Pre-requisite: CTE
- Do Fact-Fact join (if needed) or use a single give fact table?
- GROUP BY dimension id(s) from step 1 and compute metrics (if metrics don’t require any information from a dimensional table) as a CTE (use an appropriate name).
- Filter the dimension table by the filtering column (if needed), such as the is_active and is_current (in an SCD2) table as a CTE. If you do not need a dimension filter, skip this step.
- The CTEs should be on the same grain so you can join them as part of the final select query.
- If your metric requires a field from the dimension table, you must skip step 2 and join with the dimension table before grouping to compute the output metric.
Here is the general format for a SQL query
with some_dimensional_cte as (
dimensional data cleaned, enriched, and filtered as necessary
),
...
, some_fact_cte as (
fact data aggregated to the output grain with any necessary data cleaning, enrichment, and filtering
)
select dimension_1
  , dimension_2
  , ...

  , aggregate(some_numerical_col) as metric_1
  , aggregate(some_numerical_col) as metric_2
  , aggregate(some_numerical_col) as metric_3

  from driving_fact_table
  left join some_dimensional_cte (inner join when fact - dimension referential integrity)
  left join some_fact_cte (on key representing driving fact table)

group by dimension_1, dimension_2, ...
order by date_dimension desc, ... -- Usually defined as part of the requirement
Note that if the output requirement has 2 or more different grains, you will likely need to use a UNION ALL.
3. Lead the conversation with a step-by-step approach and stating assumptions
The key point you want to convey is your competence. You need to convince the interviewer that you will be able to hold your own (if you are interviewing for a junior role) or show that they will be lucky to have you on their team. You can demonstrate this by clear thinking, not jumping to conclusions, questioning data and its relationships, and stating assumptions and tradeoffs.
4. Conclusion
To recap, we saw how to
- Define the inputs and how they are related
- Create an ERD of the input tables
- Define the dimensions and metrics necessary for the output
- Step-by-step process to write SQL from your outputs and given inputs
- How to lead the conversation
If you are preparing for data engineering interviews, make sure to use this template to crack your SQL interview. Share this with your friends and colleagues to help them ace their SQL interviews.