1. Introduction
Dealing with breaking pipelines, debugging why they failed, and putting up a fix are everyday tasks for a data engineer. If
You have encountered pipeline code that is difficult to read, or you don’t know where to start.
The pipelines you deal with are like black boxes. You don’t know what’s going on there, and when they break, you can’t tell why or where.
You can only tell if your pipelines failed when a stakeholder raised an issue!
If so, this post is for you. In it, we will discuss how to build pipelines and systems that enable anyone working on them to diagnose issues and implement fixes quickly.
By the end of this post, you will know how to create effective logging systems that make dealing with issues simple, quick and joyful!
Note: This is part of a series of posts about data engineering best practices:
2. Setup & Logging architecture
Setup instructions are in this GitHub repo.
3. Data Pipeline Logging Best Practices
We will use Apache Spark to demonstrate the concepts below. However, these concepts can be applied to any code-based data stack that you may work with.
3.1. Metadata: Information about pipeline runs, & data flowing through your pipeline
Metadata is an overloaded term. When we talk about metadata in the context of logging, we can think of data representing the
State of your data pipeline: This represents data about your pipeline’s past and present runs. Some examples are run state (success, fail, in progress), time taken to run each task in a data pipeline, etcWhat, How, Where, & When: With this information, you should be able to determine the code flow of your data pipeline, along with its inputs, its execution engine (Spark, Snowflake, Python, etc), and time of execution. We should ideally have this level of information for each function of your pipeline, making it easy to reproduce and debug issues as needed. Example: Inputs to every function, number of retries, etcState of your data: This represents data about the data sets involved(input, intermediate, and outputs) as part of the pipeline. Some examples are statistical information such as min, max, mean, median, data schema, natural key, raw storage location, etc
Orchestrators generally store information about the state of your data pipelines (which powers their UI). Some orchestrators provide options to store the What, How, Where, & When and State of your data (see Dagster’s asset observations).
In our code, we capture the
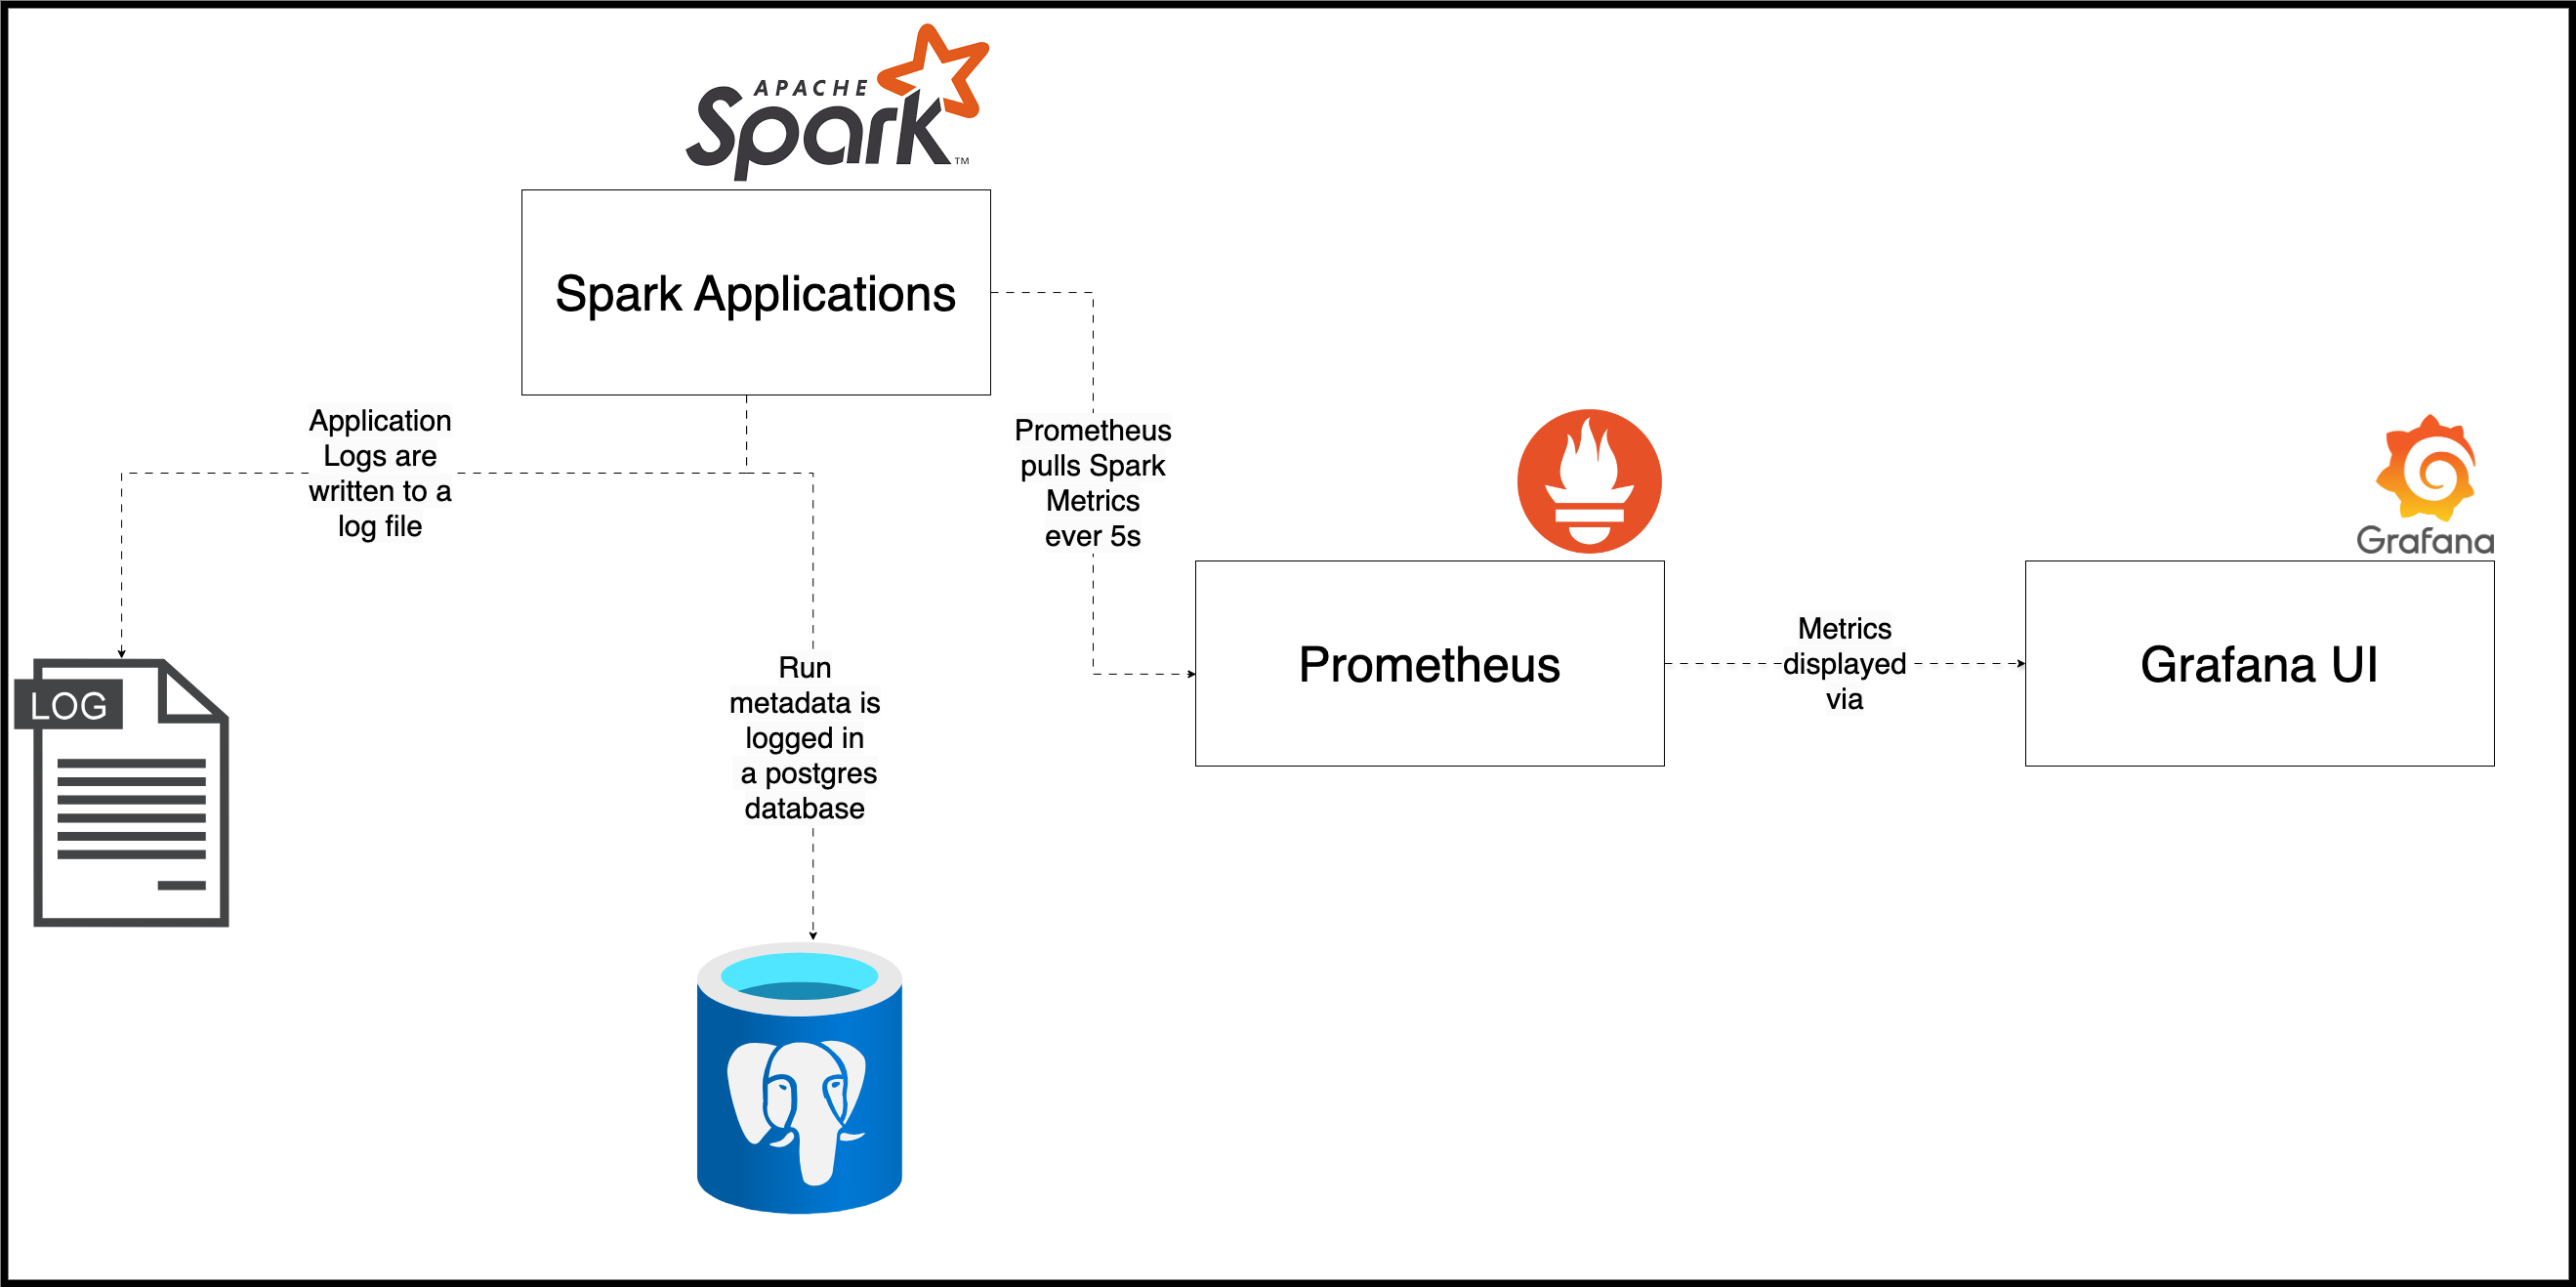
State of our data pipelineis available via the Spark UI at localhost:4040 during the application run and via the History server at localhost:18080 after the job is complete.What, How, Where and Whenwith our log_metadata function that logs all the inputs to a function, along with the time of execution and unique run id into our metadata DB.State of datais defined as a dataclass called DeltaDataSet and logged as part of the log_metadata function.
Capturing metadata is critical, as data pipelines can fail for many reasons. Knowing the exact inputs that caused a failure is essential to implementing a proper fix.
3.2. Obtain visibility into the code’s execution sequence using text logs
Logging is critical for quickly identifying where and why an unhandled issue occurred or explaining why a particular part of your code threw a specific exception (e.g., the File not found exception).
Here are some pointers to enable better log capture
Add logs before the code to be logged is executed. Logging what your code is supposed to do before code execution ensures that if part of the code fails (for any reason), you can quickly identify where the failure occurred. Logging before code is beneficial with Apache Spark (JVM systems), where the stack trace may be long and hard to decipher. For example, we log that we are about to create datasets before creating datasets.Ensure you print the entire stack tracein case of an error.- Ensure you
don't lose logs when a system issue occurs. For example, If you are storing logs as local files in an Airflow worker and it dies, you may lose the log files unless you set up a remote log cloud storage location. - If you are working with distributed systems(e.g., Spark), Ensure that logs from all workers & executors are collected. We set up log4j2 Spark logger to capture logs.
- Use an
establised log format. It makes reading and ingesting logs simpler. Make sure the logs persist in a fileand do not just print them to Syserr. Persisting logs will ensure that the logs can be analyzed even if the process producing the logs shuts down. Most loggers have functionality to handle log files & enable writing to a file, rotating files, etc. For example: Airflow S2 remote logging- Do not use print in production pipelines!
3.3. Understand resource usage by tracking Metrics
Suppose you use a system like Spark or run all your data processing via something like Polars. In that case, it is critical to measure its system metrics, such as disk usage, memory usage, CPU usage, etc, over time. Capturing these metrics enables you to
Set up alerts when usage goes over a specific thresholddue to buggy or non-optimized code, massive datasets, etc.Scale up or downto save on cost and ensure pipelines run without issues due to the unavailability of system resources.Provide visibility into resource utilization.
Apache Spark makes metric collection simple by exposing detailed metrics about its services. See here for list of all available metrics.
An external system usually collects, stores, and processes metrics. E.g. DataDog, Prometheus. Our code exposes Spark metrics via an endpoint in Prometheus format. We also schedule a Prometheus job to look for Spark metrics every 5s and store them in its database. We can then use an already set Graphana to query these metrics.
Note that absence of metrics can also be a sign of your systems not working. The external system that monitors your data processing system will need a system to monitor it—for example, Prometheus can self-monitor itself via a dead man’s switch.
3.4. Monitoring UI & Traceability
Logging metadata, text logs, and metrics are great, but without a proper medium to expose them helpfully, the amount of data can get noisy! It’s critical to have them organized for quick observations and provide the ability to dig deeper as needed.
With data pipelines, typically, there are three user interfaces where a data engineer can gather information about a pipeline.
Orchestrator UI: This UI monitors the progress and execution history of data pipelines, their tasks, how long they took to run, and when they ran.Monitoring system: Used to monitor system metrics such as memory, disk usage over time, logs, etc. For example, the Grafana dashboard queries a Prometheus backend that stores your metrics.Data quality and KPI dashboard: These are typically dashboards built internally & consist of data quality metrics and the data team’s SLA (if any). OSS tools, such as elementary and vendor solutions like Monte Carlo, aim to solve this.
Traceability A key concept to understand with observability is ensuring that a user can identify all the log data of a specific pipeline run. Traceability refers to associating logs, metrics, and DQ metrics that belong to a particular pipeline run across multiple systems. Creating a unique identifier is typically how this is done (e.g., unique id = Unique pipeline name + idempotent input field such as partition the pipeline will work on + the time when it ran).
A unique traceable identifier will ensure that even if we run the same pipeline with the same inputs, it will be logged as two individual runs. Understanding which log belongs to which pipeline run can be easy with traceability.
In our code, the unique run ID is set as the following (code link:
3.5. Rapid issue identification and resolution with actionable alerts
When an issue occurs, an alert must be sent to the team most likely responsible. While alerts are great, too many or too verbose alerts can create a lot of noise, making it hard for engineers to respond timely to high-priority alerts.
For alerts to be effective, it needs to be
Sent to the most likely owner of the issue. For example, The data platform team will receive any system-level alert (say, no executors alert). However, the source of the problem may be due to a bug in the code (written by another team) or extensive input data, etc.- Have
links to all the appropriate monitoring systemsthat can help with an issue, such as text logs, stack trace, Orchestrator UI, and system metrics. Identifying appropriate logs is only possible if you have a traceable key. Easy to understand, the alert needs to display information for the following:- Why is it an alert? The alert title should explain why it is an alert, e.g., pipeline_a failed due to a primary key data quality check failure.
- When did the issue occur? The alert should specify the time the issue occurred. Make sure to display the timezone.
- Where did the issue occur? The alert should specify the URL of the cluster/database/k8s task/Airflow worker (e.g., Spark cluster-ID, Snowflake warehouse) where the issue occurred.
- How did the issue occur? The alert should specify the inputs and the function/method (or link to stack trace) that caused the issue. Debugging becomes easier if the on-call engineer can reproduce the issue.
- What was the issue? The alert should show the full stack trace.
Absolutely necessary. If your system generates multiple alerts for which no action is needed, it will overload your data engineers.- Use an appropriate delivery system, such as Slack, email, Pagerduty, etc., with proper escalation if the on-call engineer does not acknowledge the alert.
4. Conclusion
This article gives you a good idea of what to log, how to log, and how to use them effectively with actionable alerts. The next time you come across a black box data pipeline, and you don’t know what’s going on there, and when it breaks, you can’t tell why or where try the following:
4.Monitor
While you may only have time to implement some of the above, start with logging metadata and text logs. These will go a long way toward alleviating the pain of debugging an obscure data pipeline.
If you have any questions or comments, please leave them in the comment section below. If you have any issues with running the code, please open a GitHub issue here.