Why data exploration
In most companies the end users of a data warehouse are analysts, data scientists and business people. Visualizing data is a powerful tool to help humans understand the patterns in data. When querying data, end users prefer a tool to help them visualize, create dashboards driven by data and be able to share their visualizations with other users.
If you are wondering
What is a good open source alternative to expensive BI tools like Looker
How to get started with Apache Superset
Then this post is for you. In this post we go over the architecture of Apache Superset, connect to a warehouse and learn how to build charts and dashboards.
Apache Superset architecture
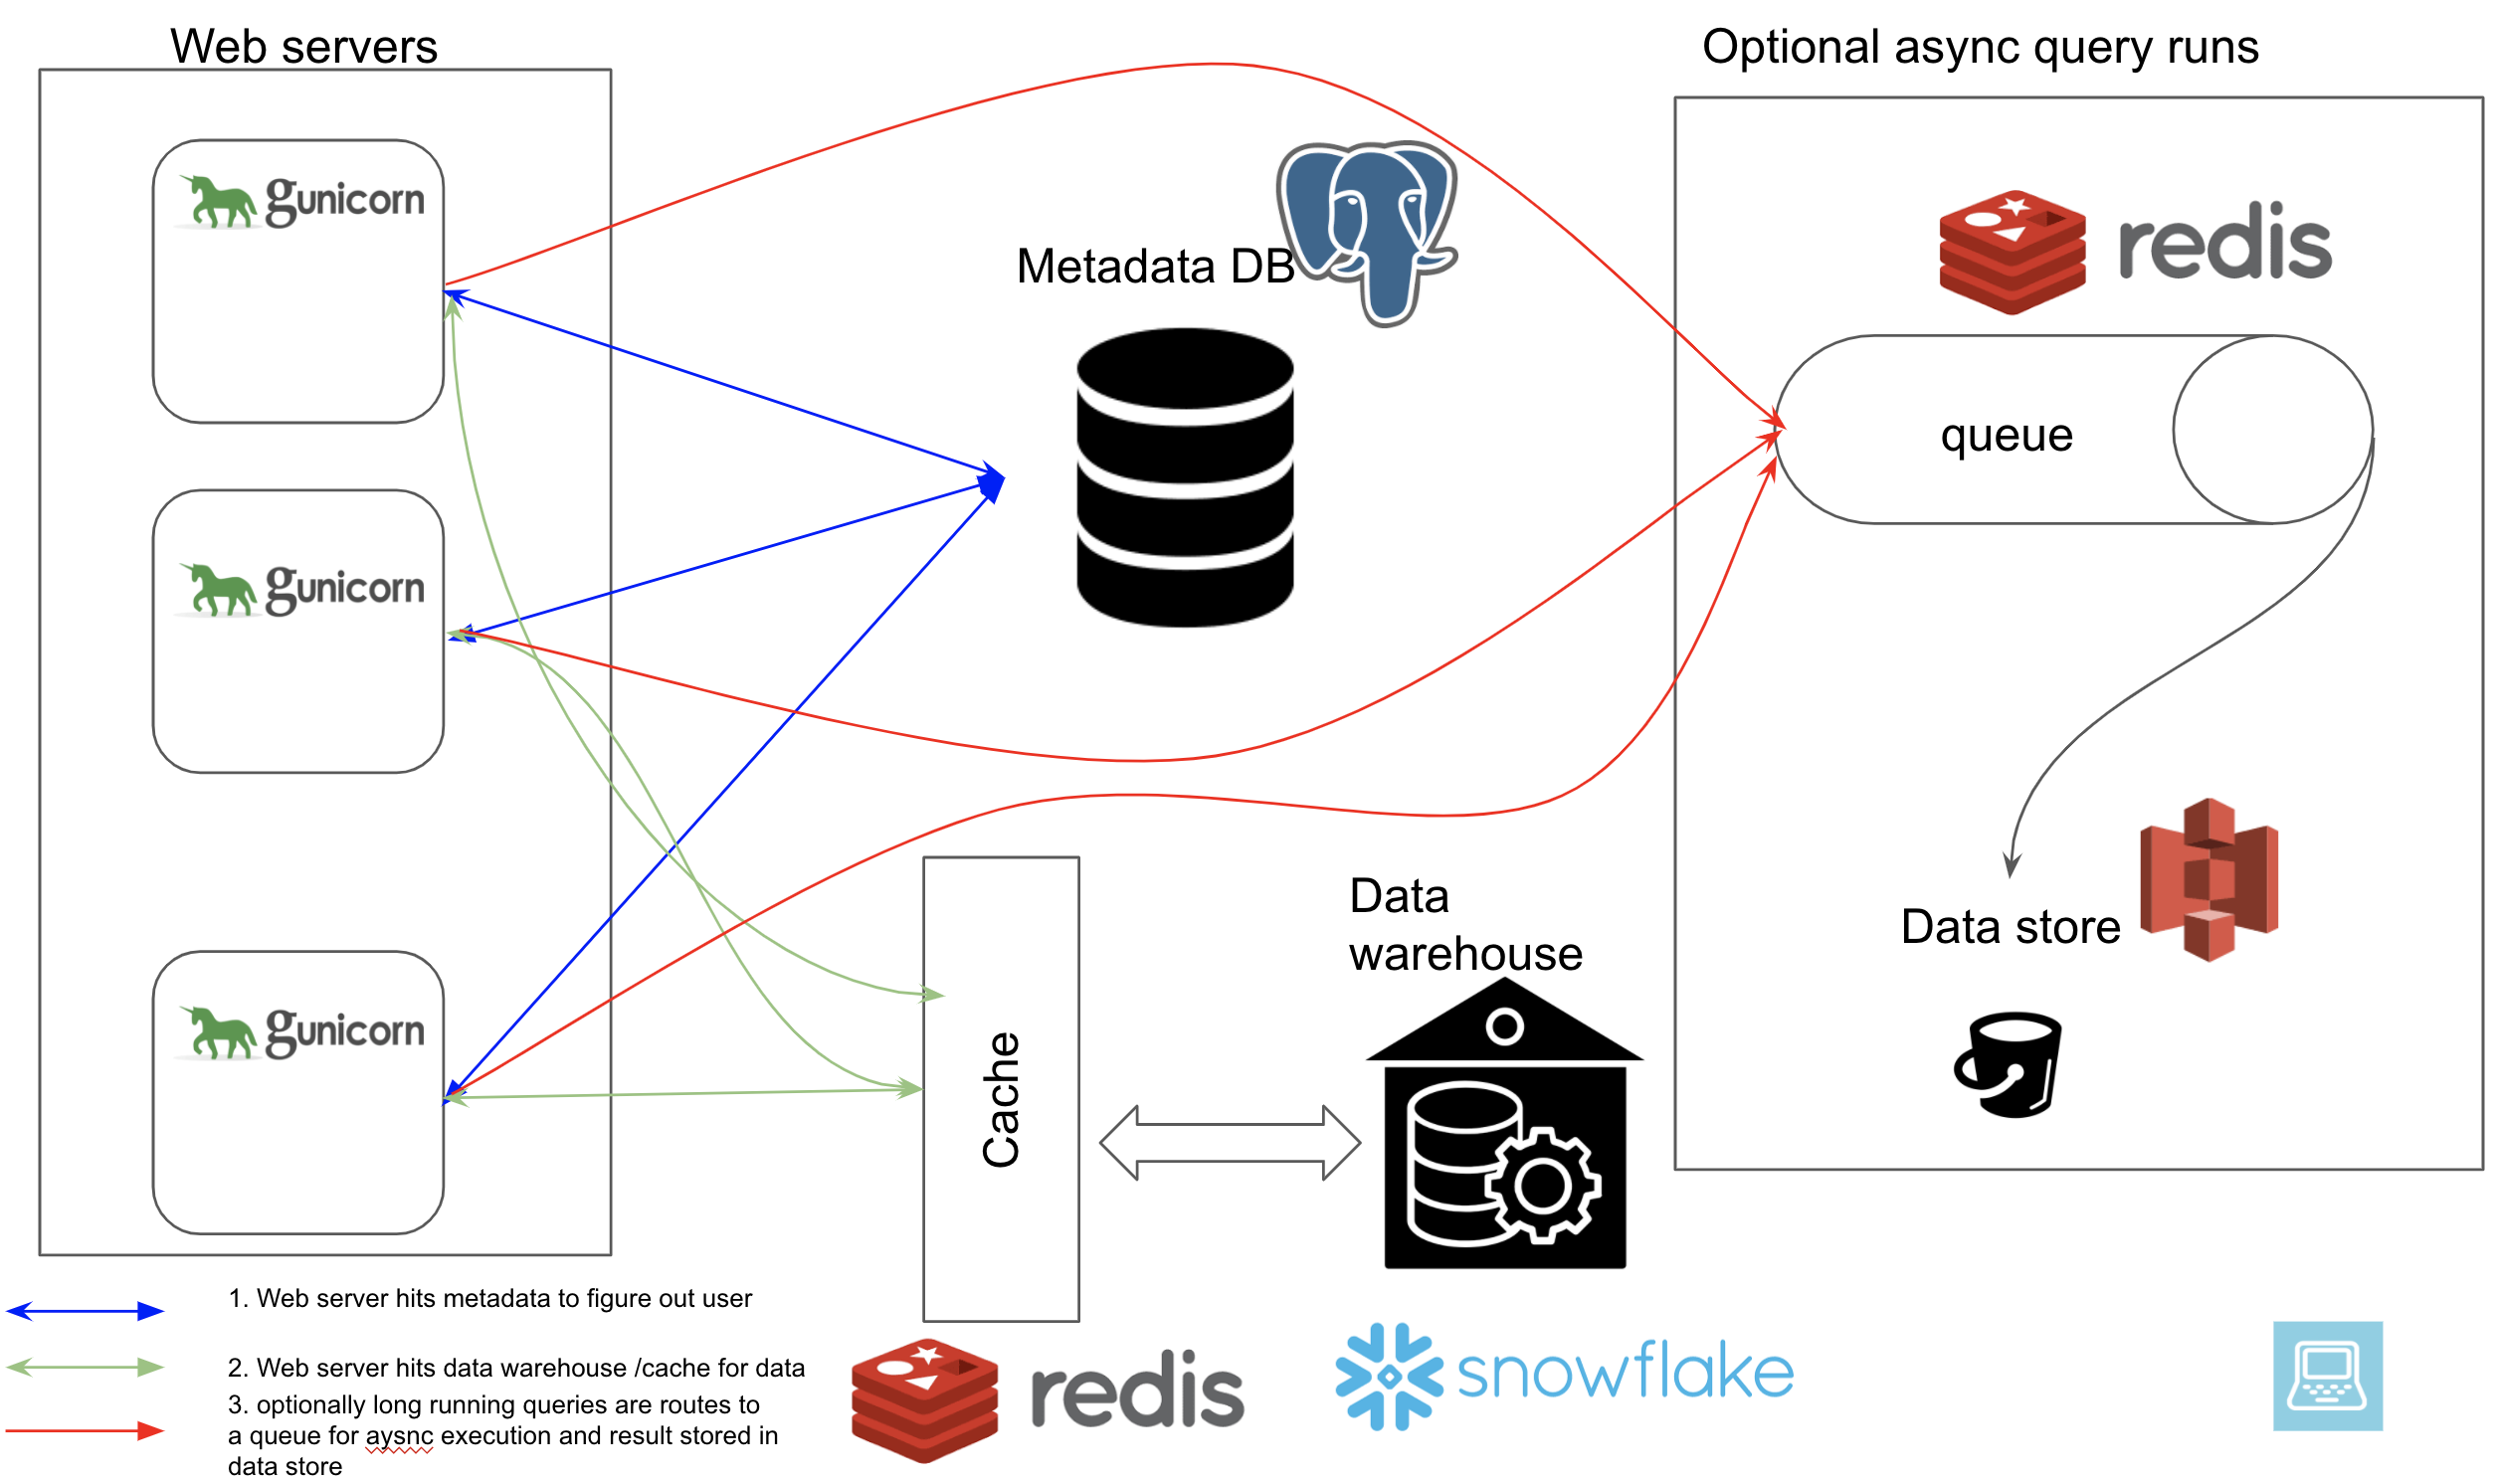
Apache Superset involves following components
- Web server (can run multiple instances)
- Metadata database
- Cache layer
- Message queue for async queries
- Results backend
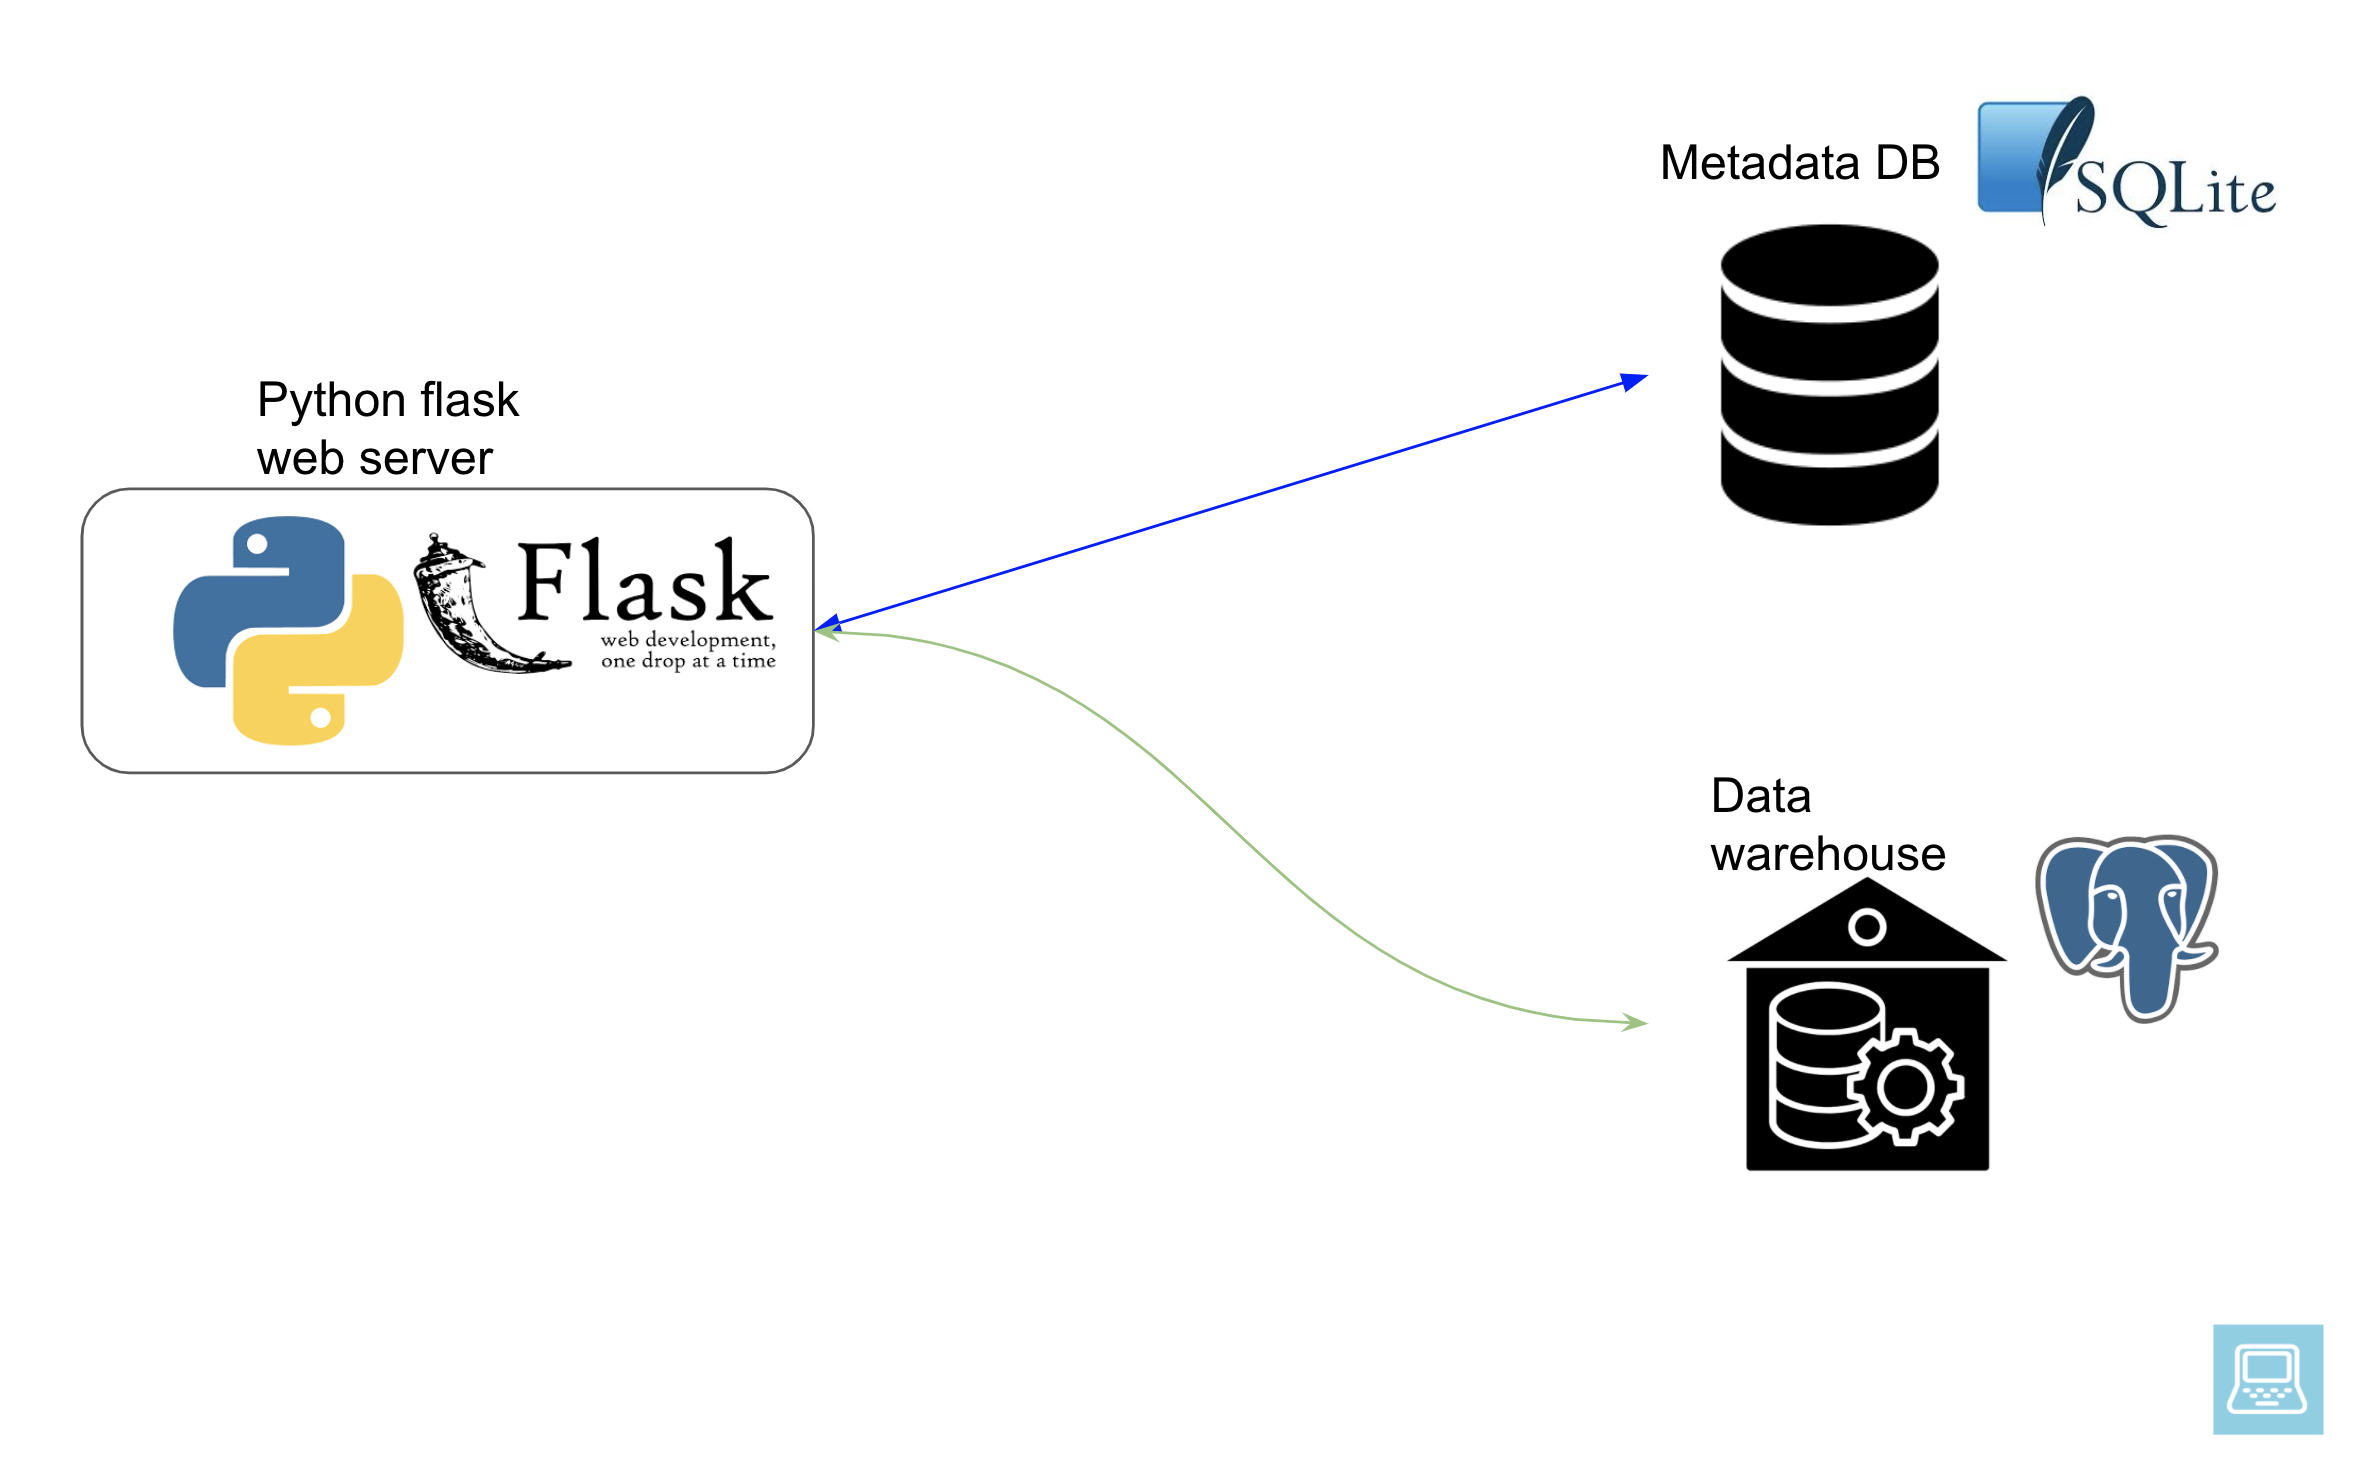
The web server is a flask python app, using sqlalchemy ORM to connect to any database. We can configure the data warehouse(s) to connect to. We can also choose the results backend we want to store the results of long running queries into.
Setup
We will use docker-compose to spin up our local infrastructure
Prerequisites
We will be using a superset docker container from here. This basically runs the web server, sqllite db for metadata database and we will also spin up a postgres instance for our warehouse. Since we are not going to be running long running queries we can skip the async execution part.
Give the containers a few minutes to spin up and then visit http://localhost:8088/ to see your Apache Superset instance.
Seed data
In the sde_superset_demo folder you will notice a data folder with some data. This is a census income dataset from UCL ML. In our docker-compose file you can see that we mount the data folder into the container at this line ./data:/data.
The official postgres container includes a setup feature, that runs any queries in the container’s /docker-entrypoint-initdb.d/ folder, immediately after starting the container. We use this to create a schema, a table, and load in the census data from adult.data file.
If you look at the init.sql file you will see the schema and table creation script.
CREATE SCHEMA clickstream;
DROP TABLE IF EXISTS clickstream.people;
CREATE TABLE IF NOT EXISTS clickstream.people (
    age INT,
    workclass VARCHAR(100),
    fnlwgt BIGINT,
    education VARCHAR(100),
    education_num INT,
    marital_status VARCHAR(100),
    occupation VARCHAR(100),
    relationship VARCHAR(100),
    race VARCHAR(100),
    sex VARCHAR(100),
    capital_gain INT,
    capital_loss INT,
    hours_per INT,
    native_country VARCHAR(100),
    earnings VARCHAR(50)
);
COPY clickstream.people
FROM '/data/adult.data' DELIMITER ',';
Using Apache Superset
Now that we have our local infrastructure setup, we can start using Apache Superset to create dashboards and explore our data.
1. Connecting to a data warehouse
We first need to establish a connection to our data warehouse. Since the web server uses sql alchemy and we are using postgres for our warehouse, we can generate a connection string using for the psycopg library as shown below.
postgresql+psycopg2://sde:password@warehouse:5432/warehouse
This is of the format postgresql+psycopg2://user_name:user_password@host:5432/database.
Navigate to Sources >> Databases and create a new database called warehouse with the above credentials and test the connection.
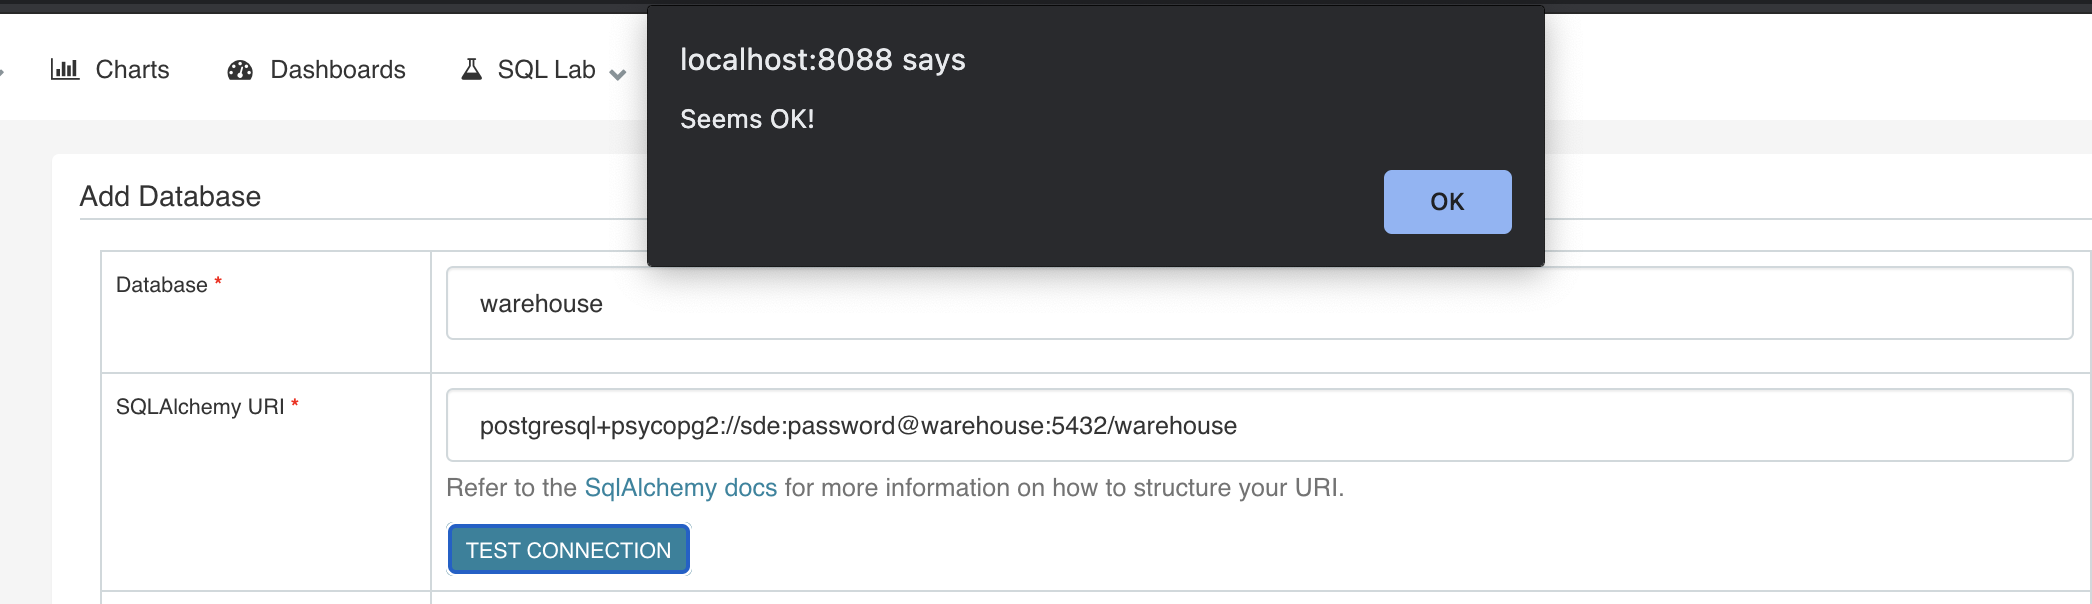
Make sure to check the options Allow CREATE TABLE AS, Allow CREATE VIEW AS and Allow DML before pressing the save button at the end.
2. Querying data in SQL Lab
We can query data in SQL Lab. Navigate to SQL Lab >> SQL Editor. Here you can write a simple sql query and run it as shown.
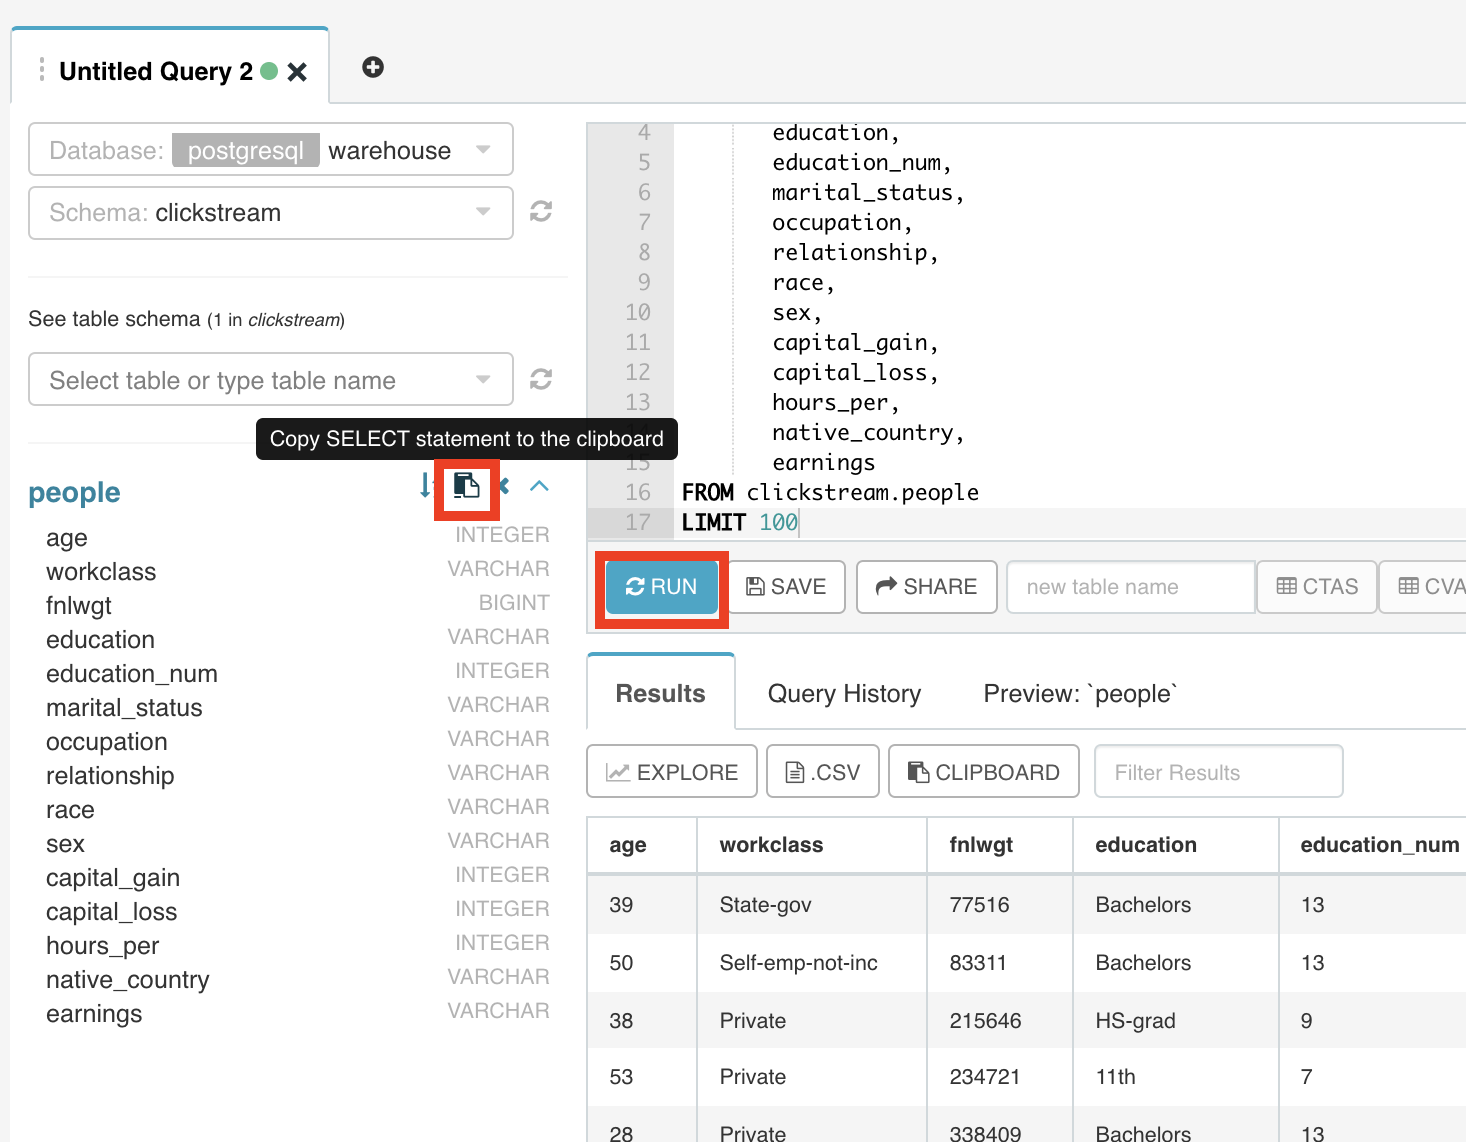
This is a standard SQL client where you can write queries and explore the data. Clicking on the Explore button will take you to a chart page, where you can start creating visualizations. ## 3. Creating a chart
Charts are based off of a single table. To create a chart we first need to define a table.
Adding a table
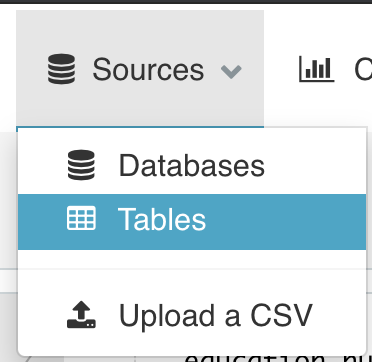
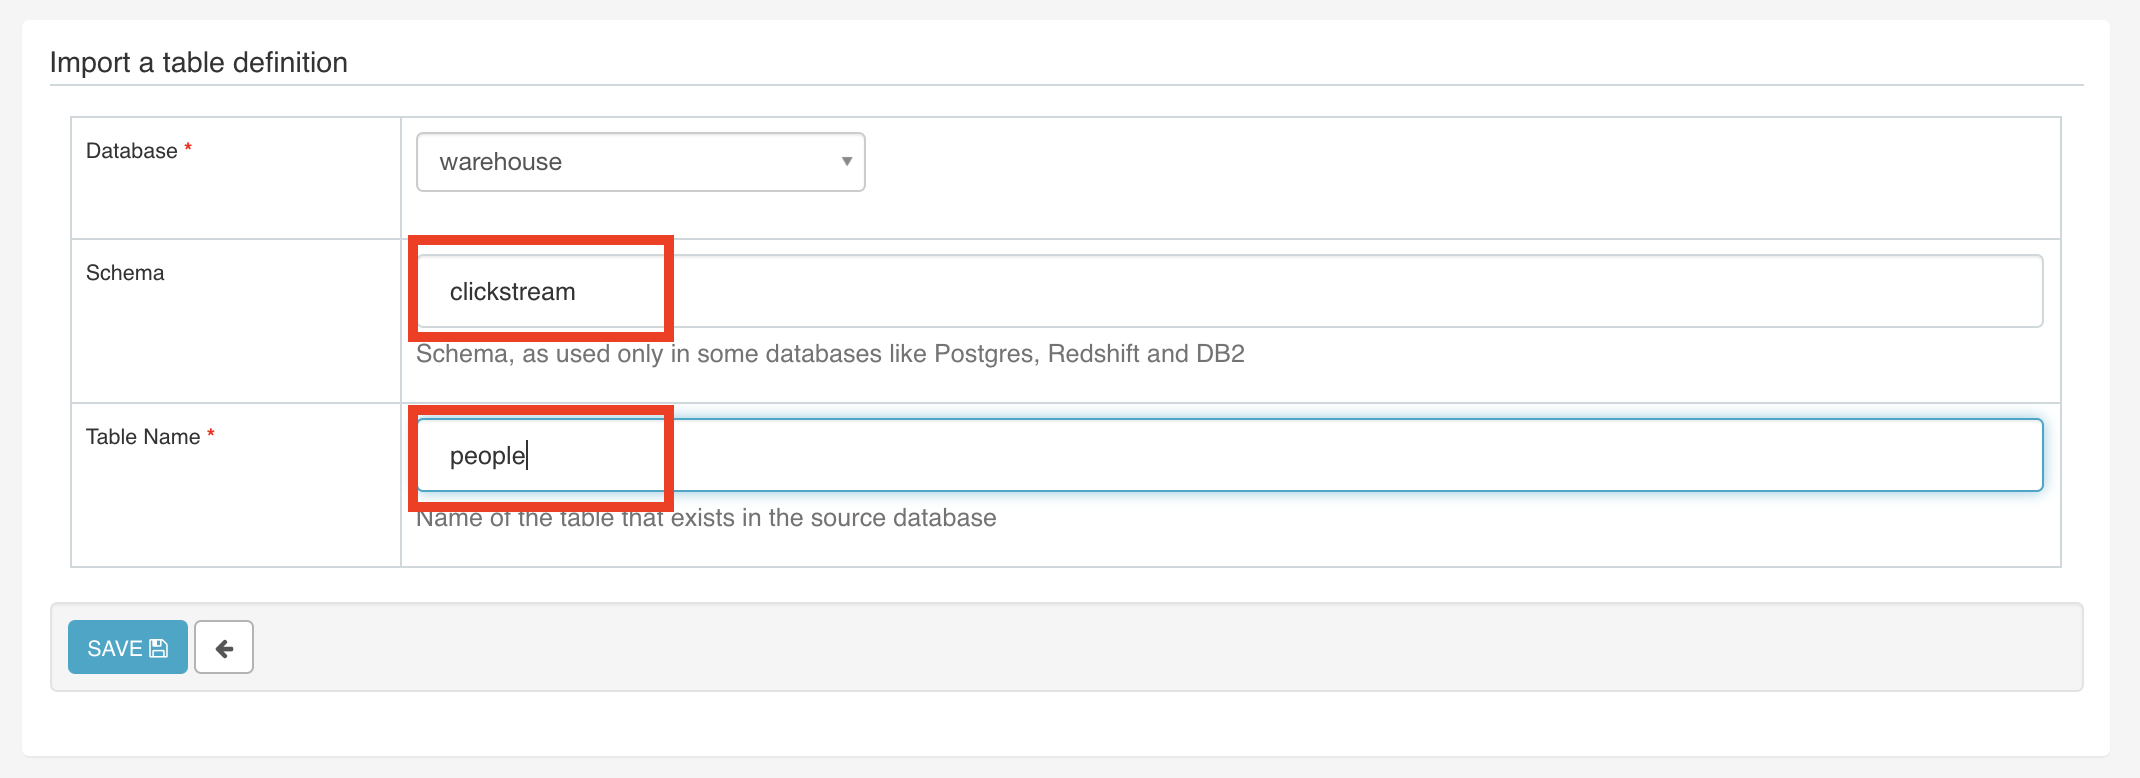
Go to Sources >> Tables, click the add a new record + sign and enter clickstream as the schema and people as the table name.
Creating a chart
To create a chart navigate to the Charts tab and press the add new record + sign.
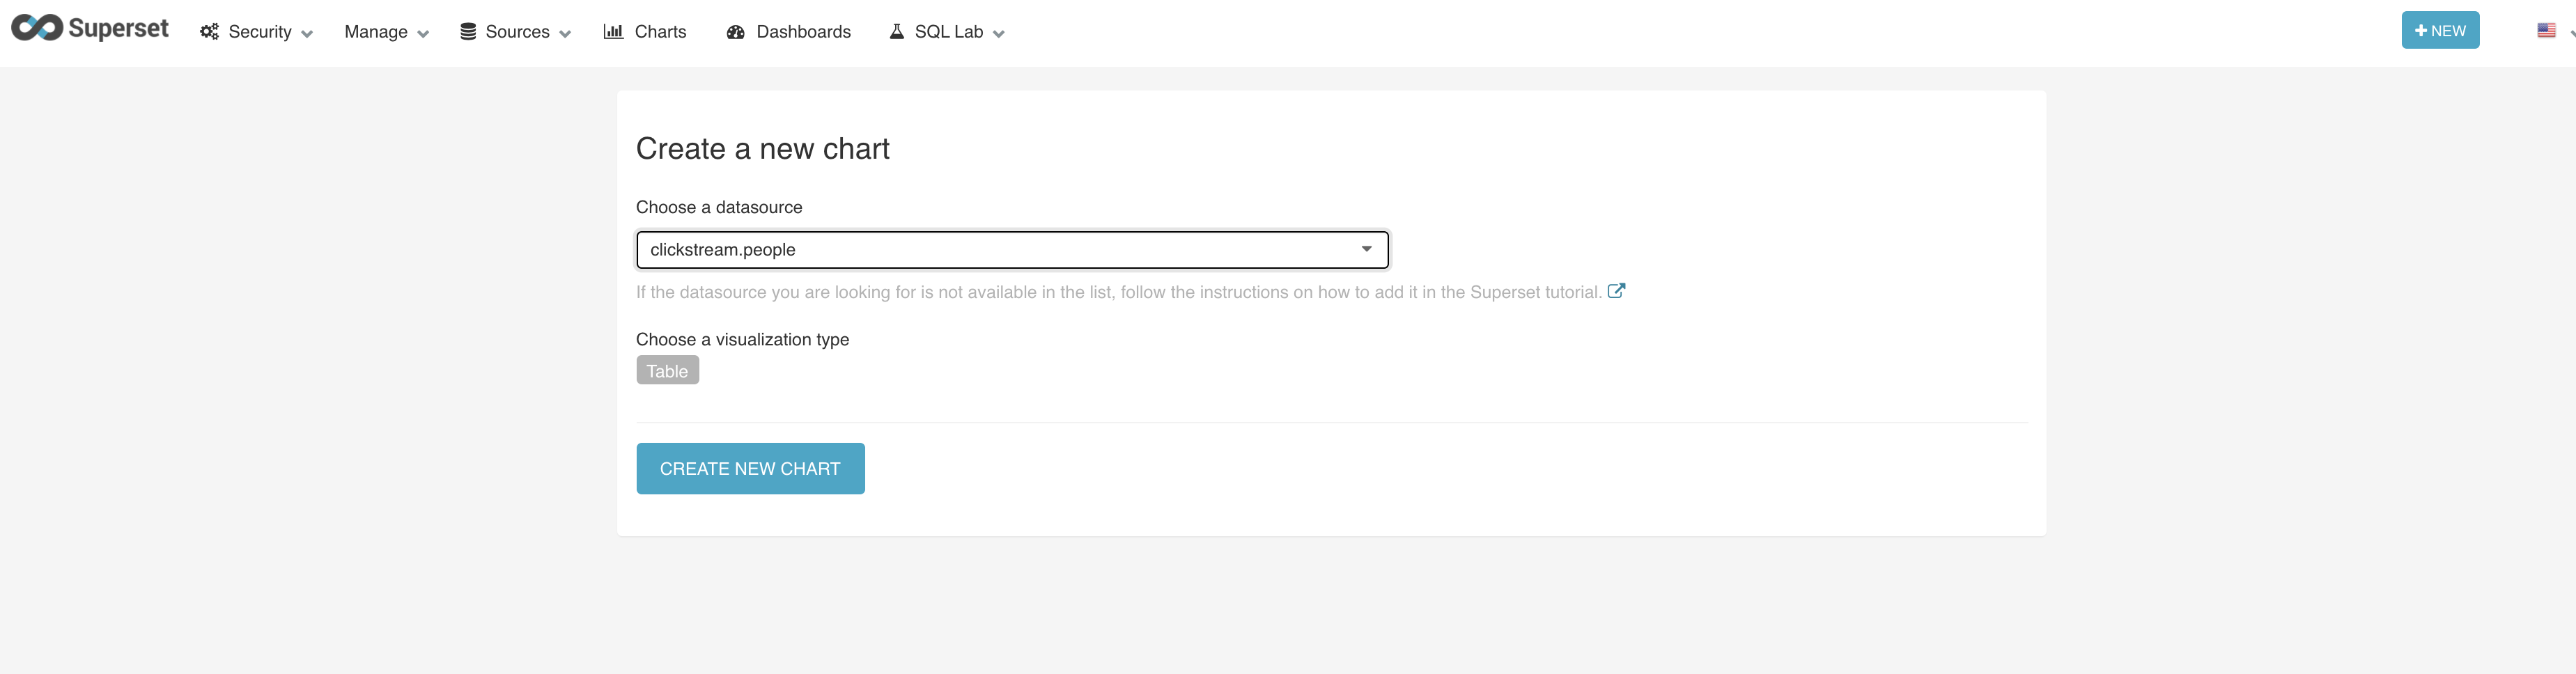
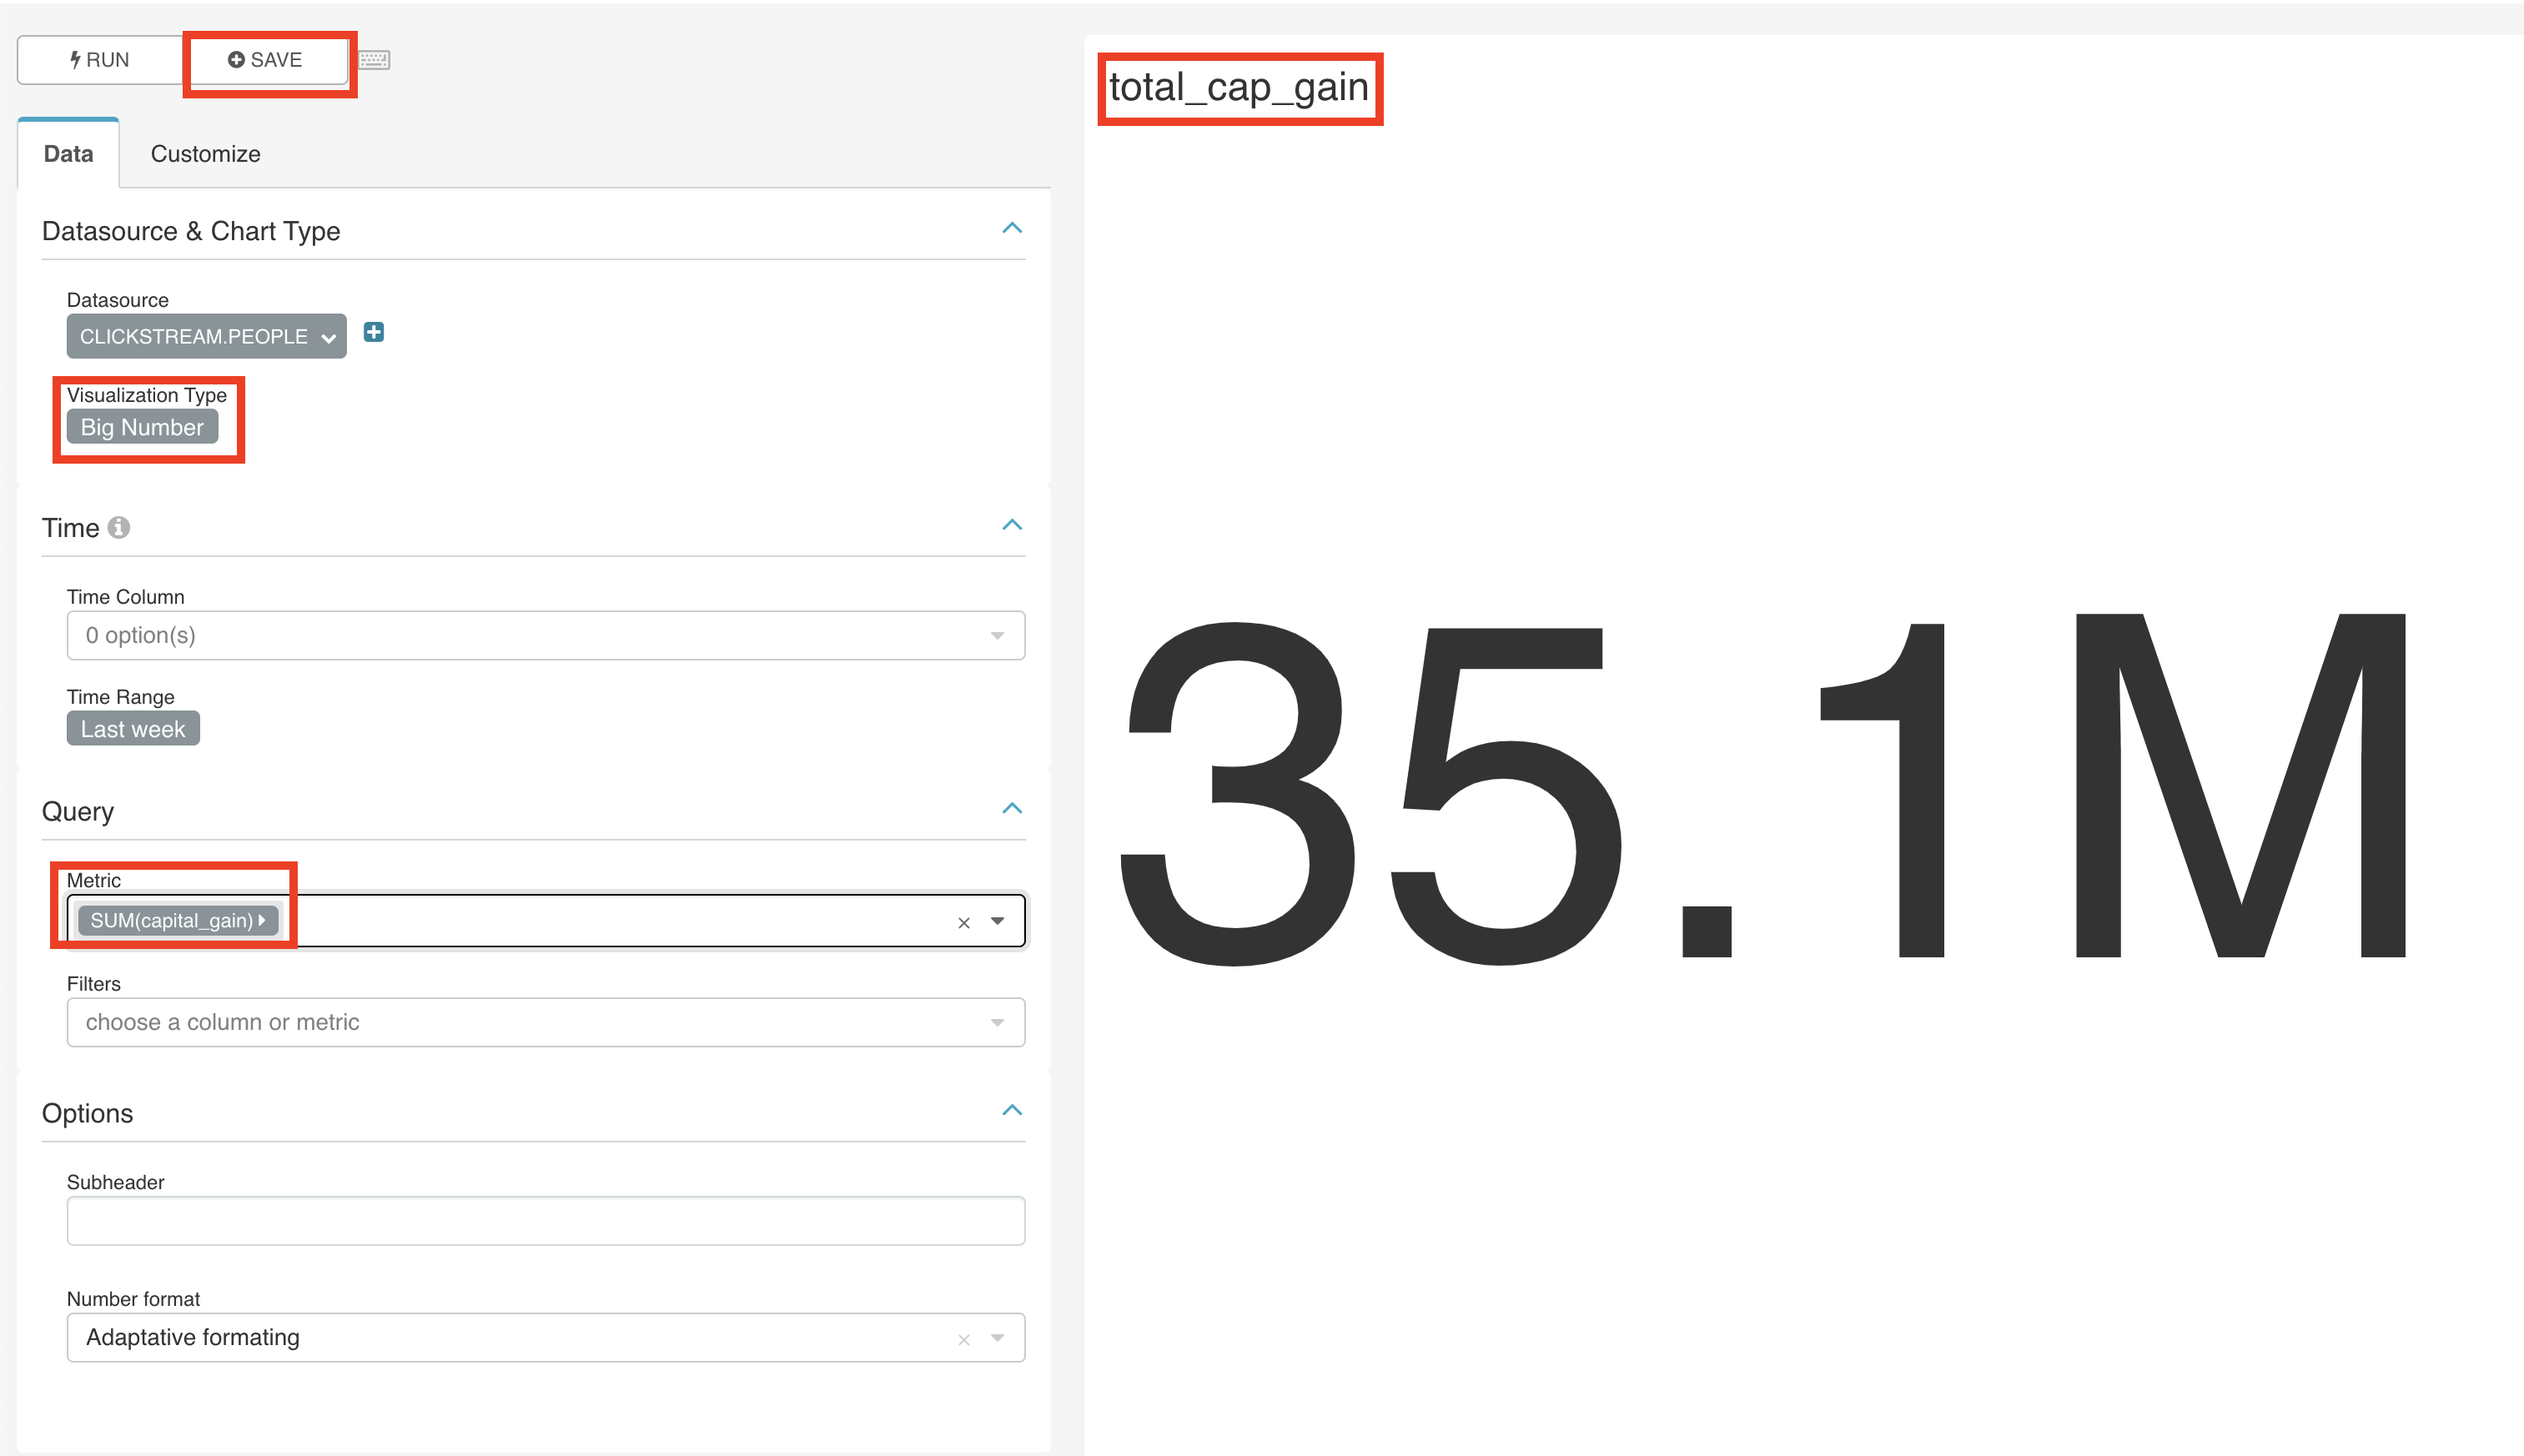
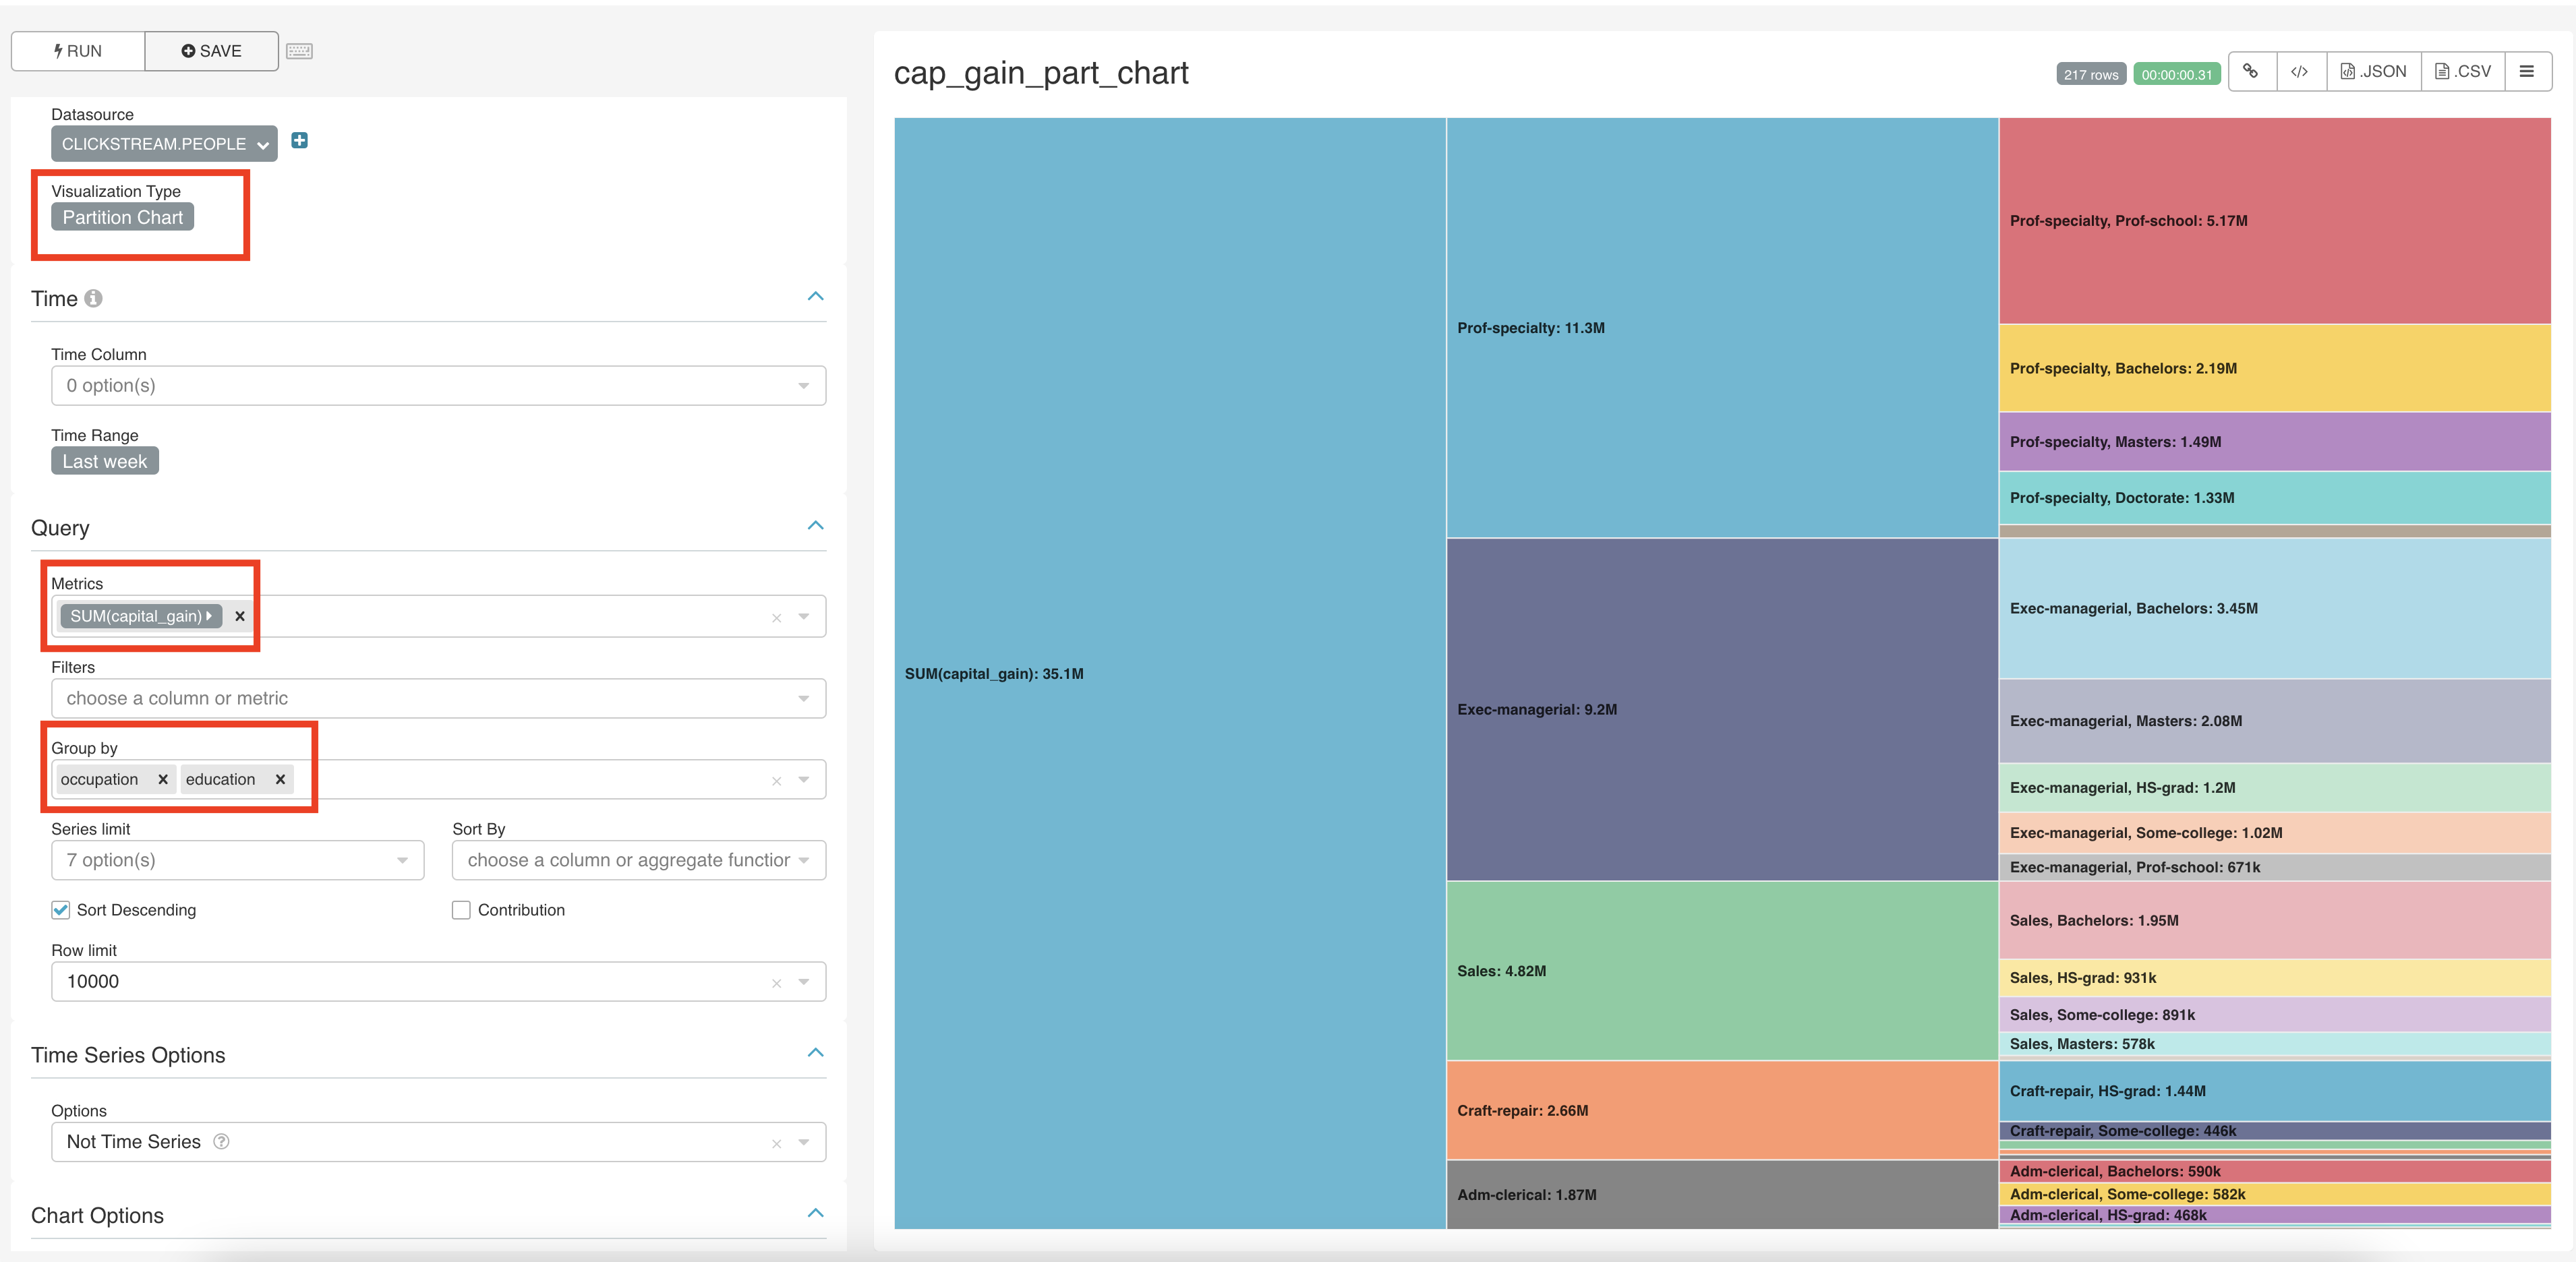
For the first chart let’s create a chart that displays the total capital gains as a big number. Save it as total_cap_gain.
For a second chart let’s create a partition chart that displays the total capital gains partitioned by occupation and then by education. Save it as cap_gain_part_chart.
4. Creating a dashboard
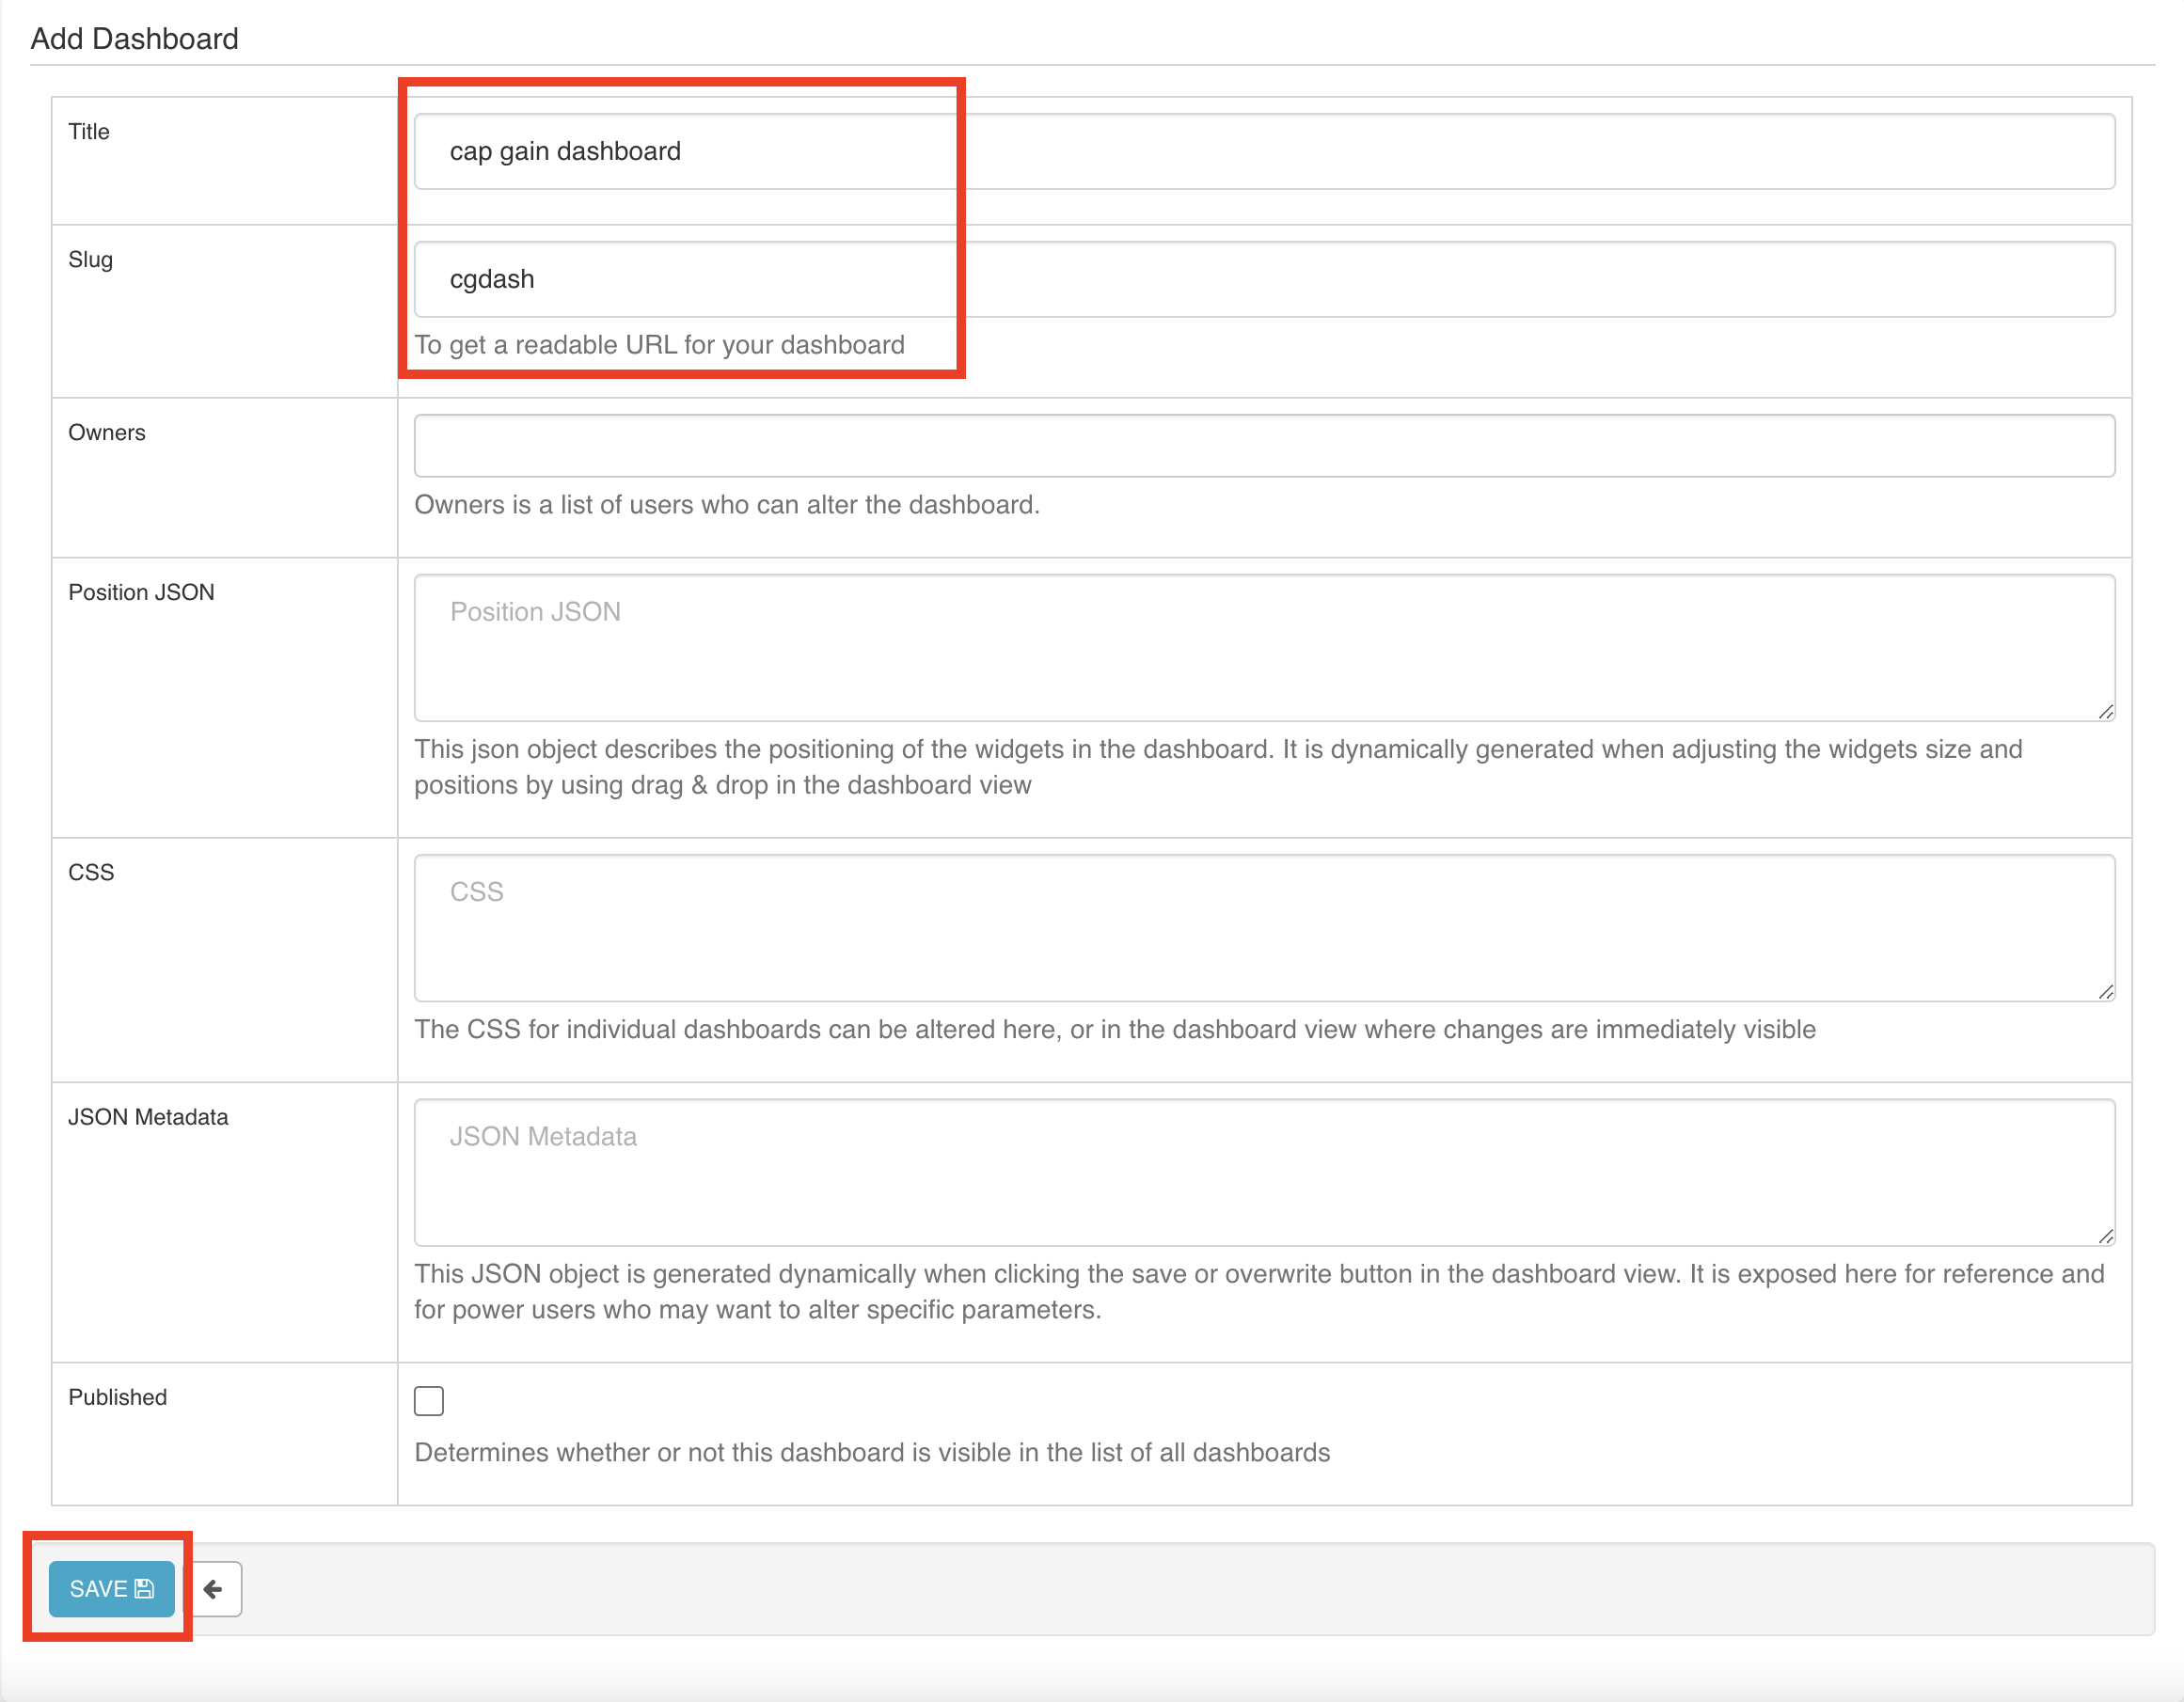
A dashboard can consists of one or more charts and can be shared across people. To create one, click on the Dashboards tab and press add a new record + sign. Let’s name it cap gain dashboard and have cgdash as the slug. We will later see what this slug represents.
After saving the dashboard ,click on it. Now press the EDIT DASHBOARD button. In the dashboard editor, drag and drop 1 row. Access the charts that you created using Your charts & filters. Put them in the same row, next to each other. Press SAVE CHANGES. And toggle the Draft to Published.
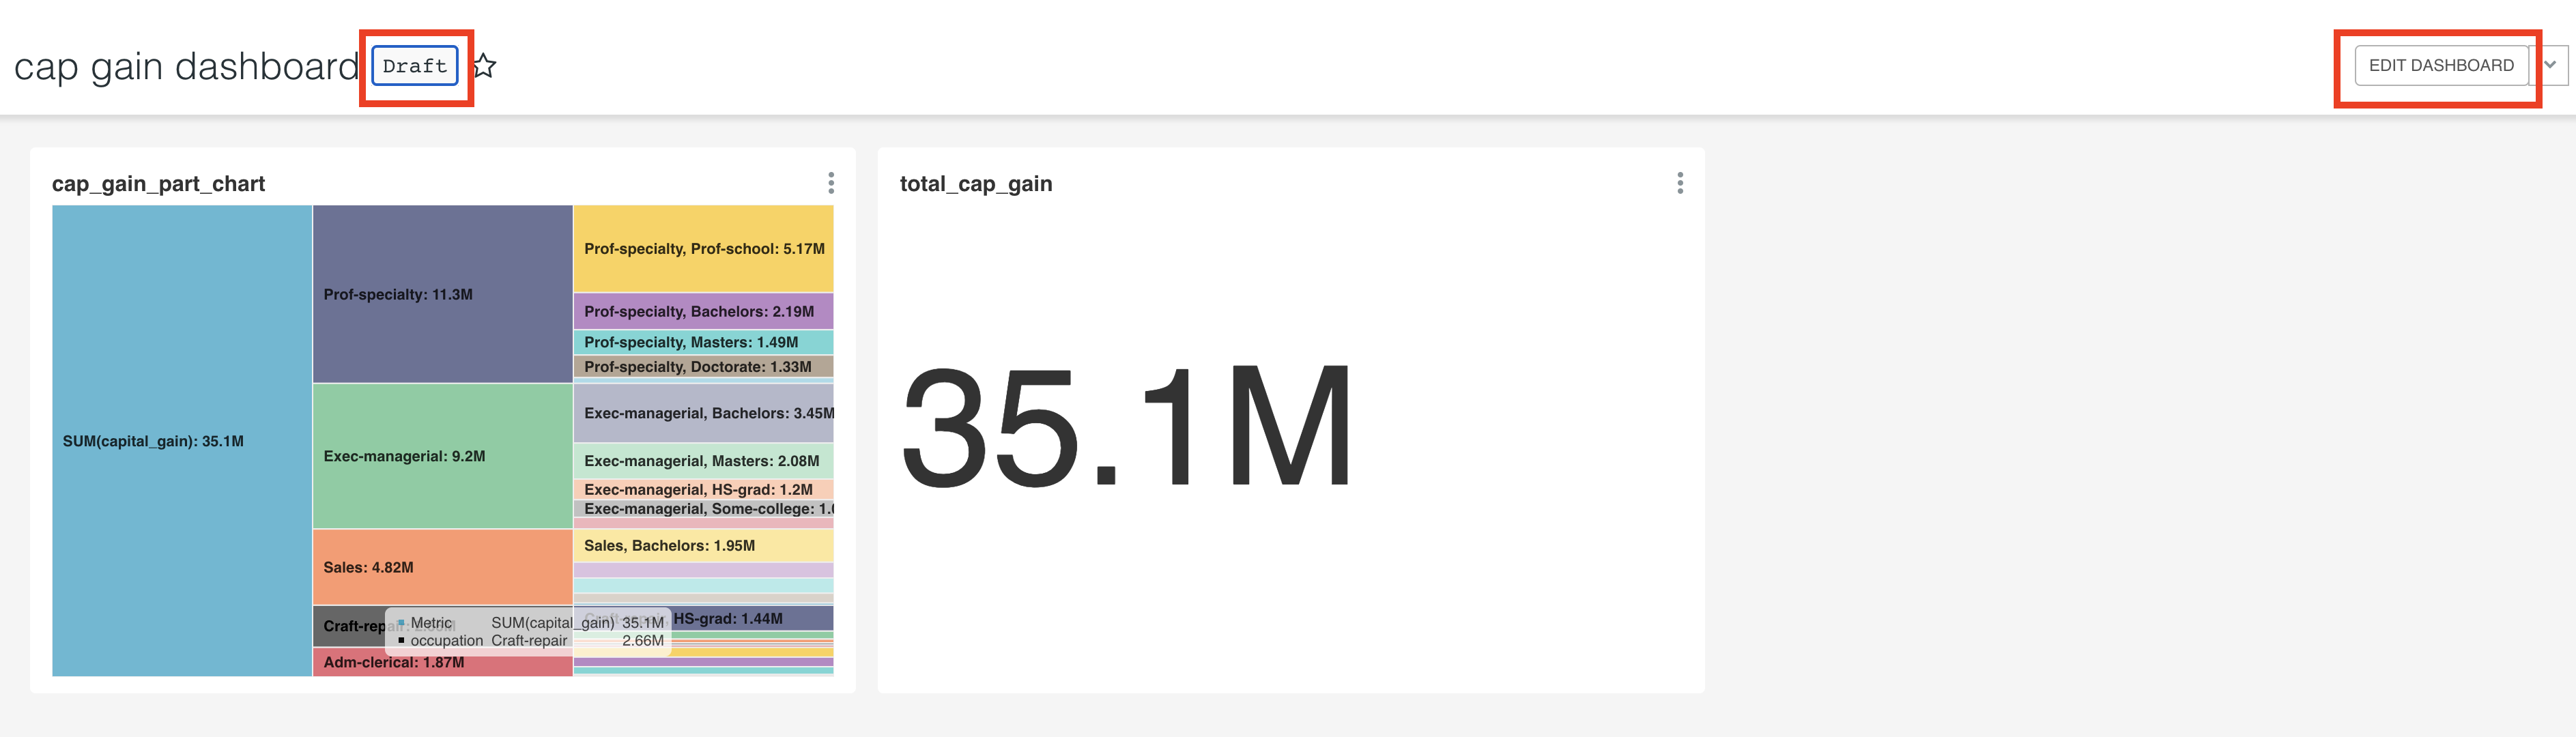
http://localhost:8088/superset/dashboard/cgdash/ is the link that another superset user can use to access the dashboard you created. Notice the cgdash was the slug name we provided while creating the dashboard.
You can customize your charts and dashboards to suit your needs.
Tear down the infrastructure using the below command
Pros and Cons
Pros
- Open source.
- Large number of pre built visualizations.
- Leverage Apache Superset to embed the dashboards into your data applications.
- Amazing community (I was able to get super fast support on a weekend).
- Simple web server architecture.
- Granular user access control.
- Rest API based on OpenAPI specification.
Cons
- Cannot do joins in charts and exploration sections. The dataset has to be pre joined or be a view.
- Users will need to know SQL. Engineers can help with creation of views, etc. But to be a fully self serve BI tool, end users will need to know SQL.
- Without a good dev ops and data team, management can be difficult. Unless you get the managed version from preset.
Conclusion
Hope this article gives you a good understanding of what Apache Superset is, its pros and cons and how you can leverage it to create visualizations and dashboards. There are more features like scheduling alert and building custom visualizations.
There are a lot of expensive vendor provided BI tools in the wild. I believe, if your company has the right engineering resources, using a open source tool has the potential to save a lot of money.
References: