spark.sql("""
WITH clickstream AS (
    SELECT
        1 AS user_id, '2024-07-01 10:00:00' AS click_time UNION ALL
    SELECT
        1 AS user_id, '2024-07-01 10:05:00' AS click_time UNION ALL
    SELECT
        1 AS user_id, '2024-07-01 10:10:00' AS click_time UNION ALL
    SELECT
        1 AS user_id, '2024-07-01 10:10:00' AS click_time UNION ALL
    SELECT
        1 AS user_id, '2024-07-01 10:10:00' AS click_time UNION ALL
    SELECT
        1 AS user_id, '2024-07-01 10:10:00' AS click_time UNION ALL
    SELECT
        2 AS user_id, '2024-07-01 10:15:00' AS click_time UNION ALL
    SELECT
        2 AS user_id, '2024-07-01 10:20:00' AS click_time UNION ALL
    SELECT
        2 AS user_id, '2024-07-01 10:20:00' AS click_time UNION ALL
    SELECT
        2 AS user_id, '2024-07-01 10:20:00' AS click_time UNION ALL
    SELECT
        2 AS user_id, '2024-07-01 10:20:00' AS click_time UNION ALL
    SELECT
        2 AS user_id, '2024-07-01 10:25:00' AS click_time
),
ranked_clicks AS (
    SELECT
        user_id,
        click_time,
        ROW_NUMBER() OVER (PARTITION BY user_id, click_time ORDER BY click_time) AS click_rank
    FROM
        clickstream
)
SELECT
    user_id,
    click_time,
    click_rank
FROM
    ranked_clicks
WHERE
    click_rank = 1
""").show()Data pipeline design workshop
Watch the live workshop here (July 4th, 2026).
Facts & dimensions are your most critical data assets
There are multiple tools to ingest data from source systems. E.g., Fivetran, Kafka S3 connector, CDC, dlt, etc. Creating reports and dashboards, and using AI Agent usage, involves combining tables with JOINS and creating metrics with GROUP BY. There are tools and entire teams dedicated to this. E.g., Semantic Layer, Analysts, Data Scientists, etc
Our job as data engineers is to make data ready for use, aka design the fact and dimension data products. There is no system or tool to automate the creation of facts and dimensions. This is because it involves a wide range of variables: business flow, evolving definitions, use-case understanding, etc.
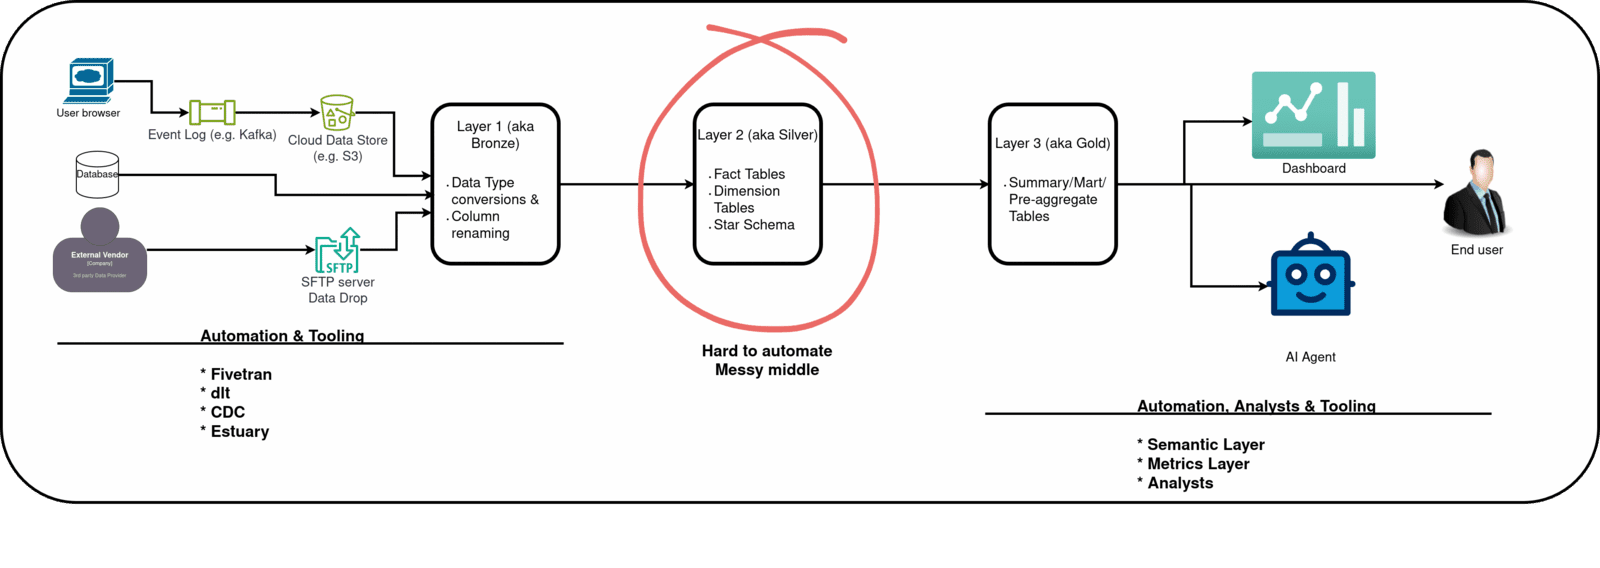
Almost every company uses a variation of the multi-hop architecture. * Data dump as-is from source * Data types and naming conversions (aka Bronze). * Data modeled as facts and dimensions (aka Silver). * Data aggregated and metrics created. Ready for select * use by users (aka Gold/Mart).
Do not worry about mapping these layers to naming conventions. Every company is different, but they all undergo layer-by-layer data transformation. Some companies may also have an Inmon-style layer before the fact and dimension layer.
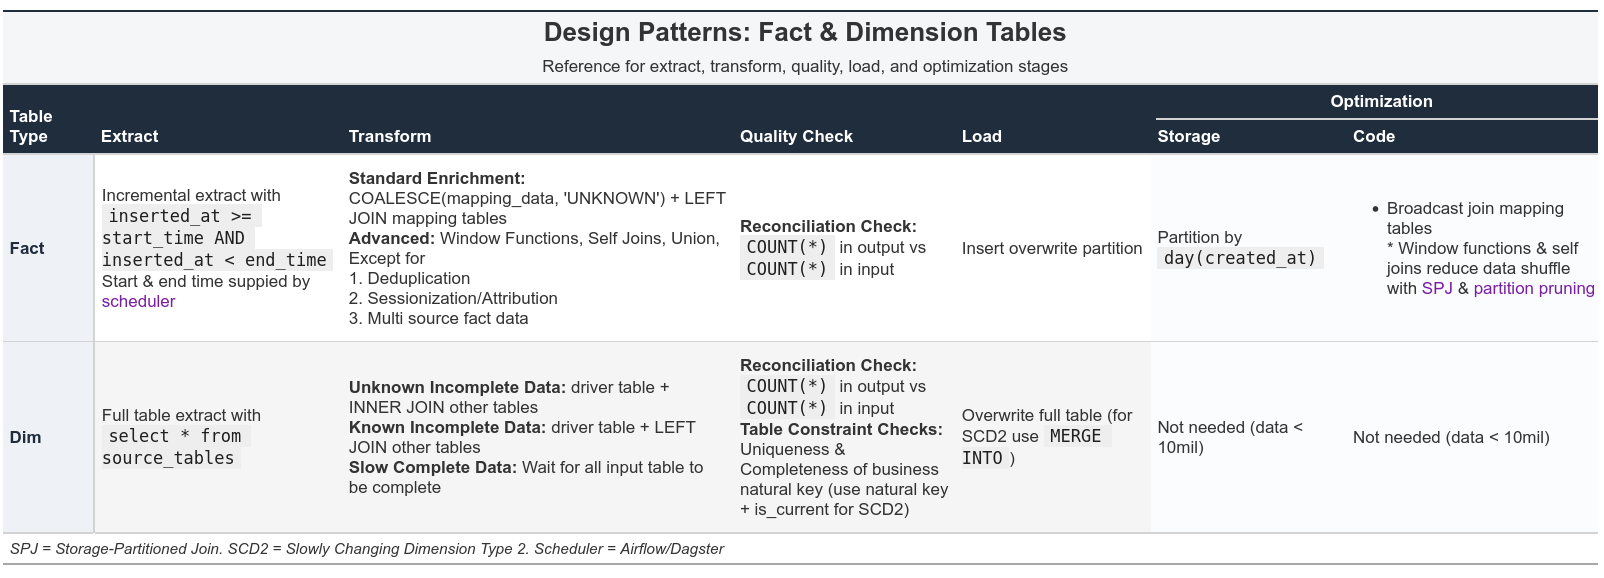
Proper design = Understanding business logic + choosing from the list of options below
Start with these patterns and change only if necessary.
In this post, we will concentrate on Extract, Transform, and Load (ETL) steps. These principles apply to real projects and system design interviews.
Fact pipeline = Incremental extract + enrich with new columns + Insert overwrite partition
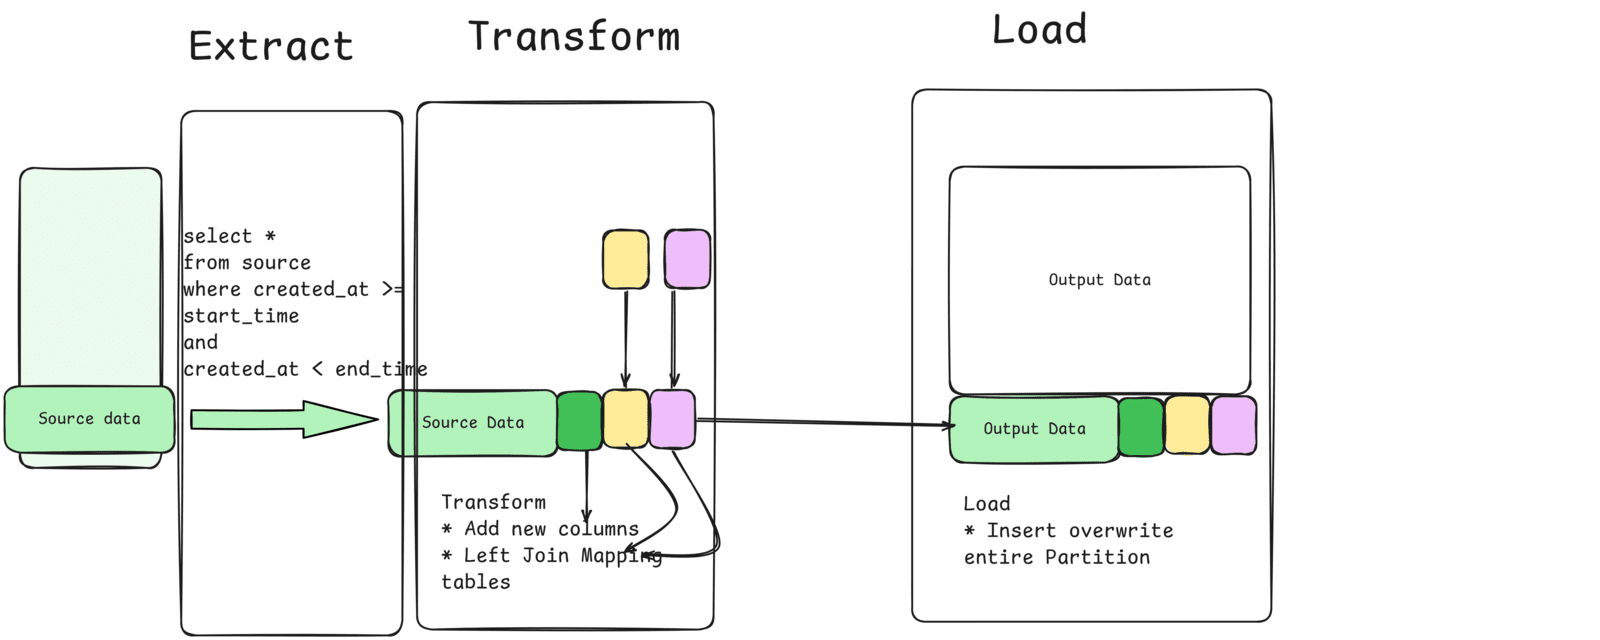
Most fact table transformation involves deriving a new column or enriching with data from mapping tables (e.g. dim_date, state_code, etc)
Note If your logic starts encoding business logic, push the upstream team to add it in the application layer. E.g., a column computing cost after a discount is valid, as it uses existing columns. However, if you find yourself changing the discount % based on a product ID, because we didn't do it in the backend, you have to push the application team to implement it
In addition to standard transformation types, you may need to incorporate a look-back style transformation.
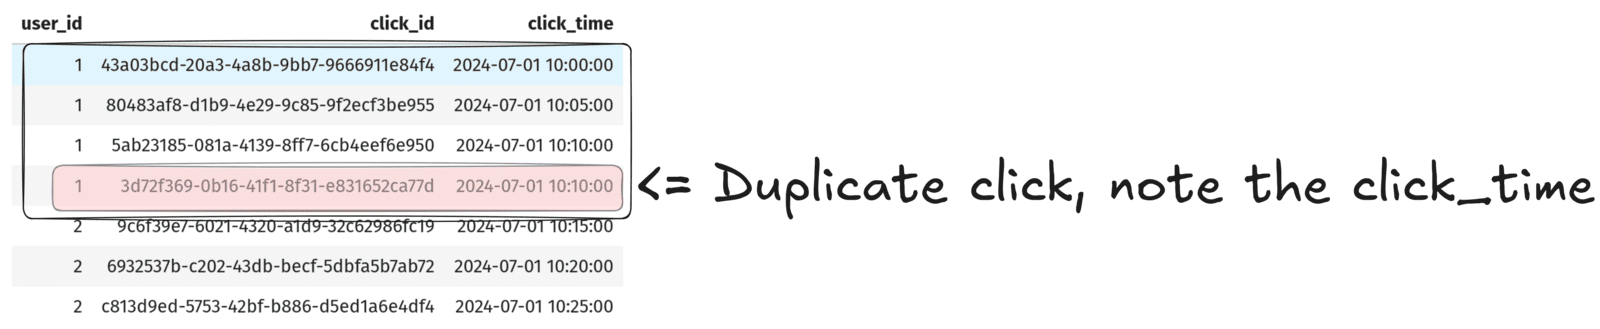
Removing duplicatesfrom the source will often involve window functions.Identifying related rowswill involve window functions or self-joins. E.g., Sessionization, Attribution, time-between-events, etc
When you get fact data from multiple sources, you will need to union/union all them. E.g., Behavior data from Facebook and Google have to be unioned.
These are flaky, especially with constantly changing input structures, and often involve columns that are present in one but absent in the other. When faced with such a situation, look for industry standards and match your data to them. E.g., OpenRTB is a widely used standard by most ad companies.
TipDe-duplication example
Write a transformation query to remove duplicates from the clickstream data (created as a CTE below)
Dim pipeline = Full extract sources, join them, overwrite table
Dimension tables are a denormalized version of upstream normalized data. We join related entity tables into a single wide dimension table
Dimension’s source data typically arrives in the warehouse more slowly than fact data.
Depending on the type of join we use, there are 2 types of outcomes for users.
Unknown unknowns: When we use an inner join, a row gets dropped due to unavailability. The user is unaware of this.Know unknowns: When we use acoalesce(dimension, ‘unknown’) & inner join, a row gets dropped due to unavailability. But the user is made aware of this.
The third option is to wait until all input data is available and then run our pipelines. But this increases table latency.
Note
But even then the data may not be full present in market segment table, the only way to know for sure is to have a metadata for market segment table or do a completeness check before transformation in our pipeline.
Incremental logic with dimensional pipelines is filled with edge cases. Dimension’s input tables are usually update-able and as such hard to reason about incremental chunks, but a full select * gives us the complete data.
Conclusion
To recap, we saw
- Good design = Understand business logic + use the right options from the decision table
- Fact pipeline = Incremental extract + enrich with new columns + Insert overwrite partition
- Dim pipeline = Full extract sources, join them, overwrite table
As with all design principles, break them when absolutely necessary. What design patterns do you use for fact and dimension tables? Let me know in the comments below.
Read these
- CDC with Debezium & DuckDB
- What are Fact and Dimension tables?
- Why do we need a data warehouse?
- What is a multi-hop architecture?
- How to partition your data?
- How to schedule incremental pull with Airflow?
- What are the types of data quality checks and when to use which?
- What is SCD2 and how to create it with MERGE INTO?